
This post was my final Diploma Project for the Institute of Acoustics (UK).
Field measurements and subjective outlook of classroom acoustics in South Africa.
Majority of a child’s educational life is spent in a classroom. In South Africa there is very little official standardization and literature that mitigates classroom acoustics. Children more often than not are taught in English, which to majority of the learners is not their home language. Language is only one of many factors that play a part in disrupting concertation. Many of the factors are beyond the control of the institutions, but the acoustic condition of the teaching space is one aspect that can be manipulated to benefit the learning experience. Enough research case studies could motivate local authorities to authorize better standards regarding classroom acoustics.
Part 1 of this paper outlines some of the available standards and literature that address acoustic conditions in classrooms in South Africa. Key points are highlighted and discussed to gain insight on the realistic outcome of these standards. The three main criteria pertain to reverberation time, noise levels and absorption within the classroom are found to be lacking in clarity and depth of explanation in the standards and literature.
Part 2 provides results and discussions of field measurements taken in various classrooms, with guidance from local and international standards. Results are compared to the local requirements. The majority of the results fall short of the discussed standards and literature in Part 1.
Part 3 details the design, construction and testing of an omni-directional loudspeaker that was built and used as a sound source for tests conducted in Part 2. The final result is a working sound source that can effectively be used to conduct acoustic measurements.
Part 1. Review of South African Standards and Guidance.
1.1 – Introduction
When standards are put in place by local government, it is usually with the best intent, but in reality compliance and implementation to these standards do not always meet expectations. In South Africa the unfortunate result is that there are building structures that do not meet the already minimal acoustical (and other) criteria set out by the public notices and standards. The major cause being the lack of knowledge of the requirements the lack of educated budget allocations towards the designing and equipping of these facilities to create acceptable standards of acoustics for teaching.
1.2 – Standards and Legislation Discussion
Three documents are discussed that provide guidance to acoustics in classrooms. The content that covers acoustics is marginal in each of these documents and little clarity is provided on the points raised. This section of the report aims to broaden the context and relate to important acoustic elements to the topics discussed.
1.2.1 – Notice No. of 2009 – South African Schools Act 84 of 1996 – Department of Education.(1)
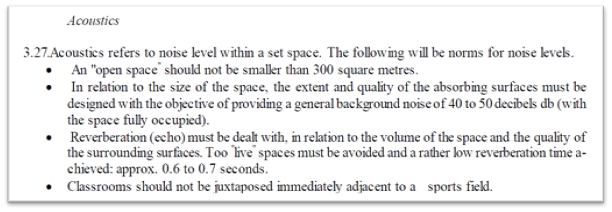
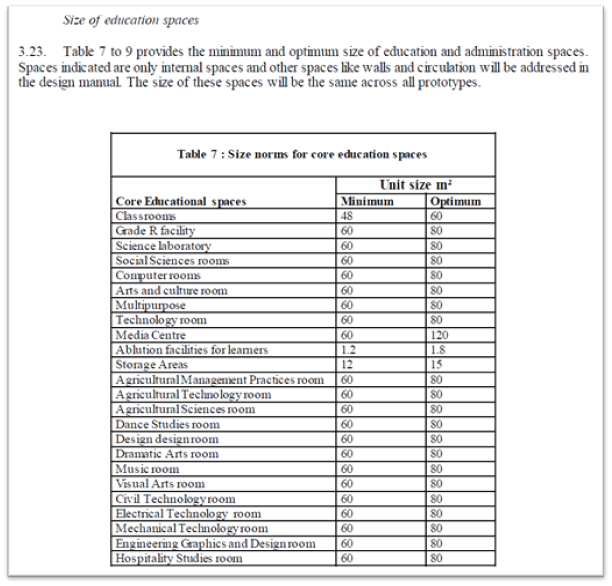
The Department of Education (DoE) in South Africa promulgated an act in 2009 called “THE SOUTH AFRICAN SCHOOLS ACT 84 of 1996”. This document provides norms and guidelines to the infrastructure that is required to be in place for a government aligned educational facility. ANNEX A.1 provides a screenshot of the single paragraph that is dedicated to the proposed acoustic conditions required of a classroom. This paragraph lists four items that concern the physical internal floor space, the occupied ambient noise levels, the reverberation time per room and the geographical location.
1. “Open space”
The first point specifies that an “open space” should not be smaller than 300m2. It is assumed that the term refers to open areas around the building structures, but no clarity is offered in the Act. The direct acoustic benefits associated can only be attributed to proximity between buildings and the transmission of sound between those building. Another attribute could be the density of students in the open space and the noise created interfering with nearby classrooms. The single figure is very vague and does not give enough guidance as the reason why and also the physical constraints that this metric holds. With the minimum requirement of 300m2 , a 4m x 75m open space has a higher probability of noise transfer that a 10m x 35m open space due to geometric spreading of sound outdoors.
2. Background Noise
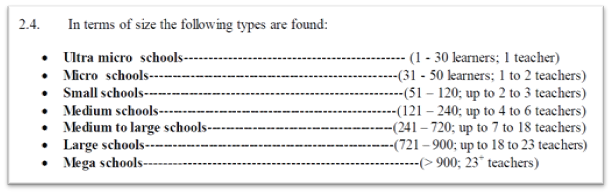
In Section 2.4 of the Act, descriptions of different school types, and guided occupancy are provided. The general range falls between 30-40 pupils under the supervision of one teacher. The Department of Education released the “School Realities 2022” (2) publication in December 2022. Over 13 million registered learners attended classrooms across the country, served by just over 450 000 teachers. The exact numbers average out to about 30 learners per teacher, but the reality is that higher density populated cities have class occupancies higher that 30 pupils. The statistic that should cause alarm is found at the bottom of the first page: “From the figures reflected in Table 3 it can be deduced that, from 2020 to 2022, the number of learners increased by 1.5% nationally, and the number of educators increased by 1.8%, while the number of schools decreased by 1.3%.”
The section that addresses Acoustics in the Act refers to an occupied background noise level between 40 – 50dB, no frequency weighting is specified. To specify a sound level with the space occupied raises various uncertainties, i.e., classroom physical size and student occupancy, teacher vocal effort, teaching style and the content being taught, verbal interaction between students and teacher and general behavior of the students.
In the same sentence the paragraph relates the internal absorption qualities of the space with the background level. This would indicate that direct to reverberant sound levels are taken into consideration with the noise generated in the space. No mention is made to sound reduction, or sound insulation from outside noise factors. Absorption would reduce the internal reverberant sound level but would do little to reduce any break-in noise from outside.
3. Reverberation time
he third item that is addressed provides guideline of 0.6 – 0.8 seconds of reverberation time. In the same breath it is noted that it should be “dealt with” the size of the space. In Section 3.23 the Act tables the recommended floor space for the various types of rooms found in a school. The recommended norm is listed between 40m2 and 60m2. Table 1 below provides the calculated Absorption Surface Area required, with the corresponding Absorption coefficient, in the recommended classroom size of 60m2 to produce a decay time of 0.6 seconds. The World Health Organization: Guidance to community noise (3) recommends a decay time of 0.6 seconds or less for classrooms. The assumed ceiling height is 2.8m and Formula 1 and Formula 2 from Sabine are used to calculate the absorption results.
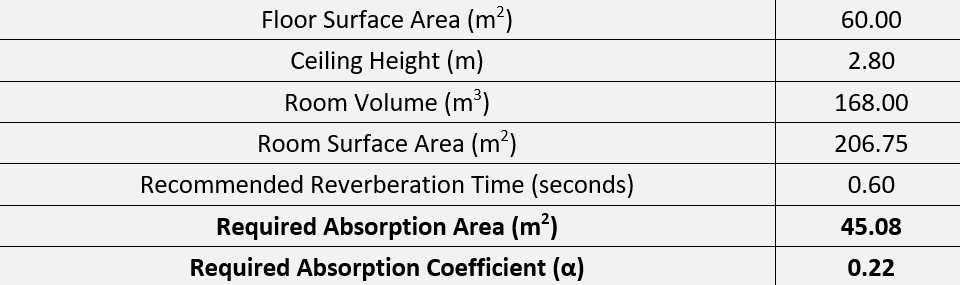
The statistical prediction of a 0.22 Absorption Coefficient is a rating figure for the combined surface area’s acoustic treatment performance. A rating of 0 means no absorption is present and a rating of 1 means there is total absorption of sound on that surface. Realistically some of the surfaces like the floor and windows do not easily achieve this rating and the treatable surfaces’ performance should be increased. This is an attainable goal but would require professional consultation.
4. Geographical Location
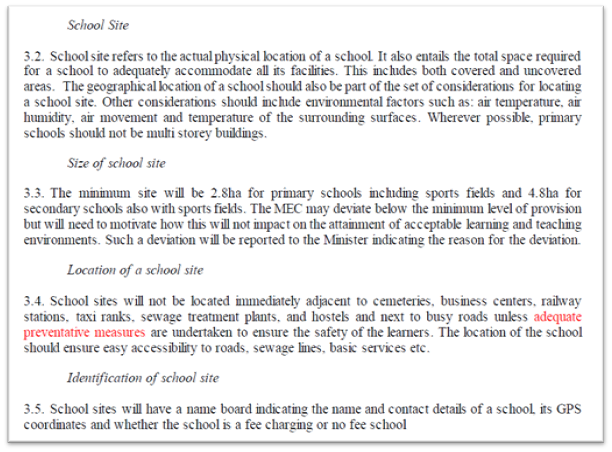
The only geographical requirement for a classroom is that it should not be next to a sports field. It is not usual for sports activities to take place during teaching time, unless it is only for the Physical Education subject that takes place during these times. Sections 3.2 to 3.5 in the Act addresses the requirements regarding the school site. Lower environmental noise factors will be the result if the site location recommendations are met. The proximity to business centres, railway stations and taxi ranks is discouraged and even though not addressed directly in this chapter, it will have a negative effect on the ambient noise levels.
1.2.2 – SANS 10103:2008 – The measurement and rating of environmental noise with respect to annoyance and to speech communication. (4)
This national standard addresses annoyance due to noise in the workplace or living environments. It provides guidance on ambient noise levels in occupied spaces under normal use in full operation. The first three items on Table 1 in the standard provide design and maximum ambient noise continuous rating levels in dBA for classrooms. For standard classrooms the levels are 35dBA and 40dBA respectively.
Table 3 in the standard provides maximum distances for speech to be perceived as intelligible in the corresponding ambient noise environments. Referring back to the Schools Act, the recommended floor space of a classroom being between 40 and 60m2, we can assume that teachers are very rarely more than 12 meters away from the furthest child, depending on the room shape. The rating table allows for a distance of 7 meters for every-day normal speech level to be intelligible in an ambient environment of 45dBA. This conclusion does not consider two factors: the first being the general noise from the occupied classroom, that varies with many factors addressed in the previous section. The second being that the majority of children in South Africa are not being taught in their first language. An adverse effect is also on the teachers having to raise their vocal effort for long periods of time and possibly suffering from vocal strain and affecting the quality of teaching.
1.3 Other Literature
A few private and non-profit organizations have released documents that provide insight and guidance into implementing good acoustic principles for educational facilities in South-Africa. One of these is the Green Building Council of South Africa (GBCSA), that serves to transform the building community in the territory. They offer strict design criteria and rating tools for a building to earn points towards its Green Star rating. The GBCSA is a member of the World Green Building Council.
1.3.1 – Public and Education Building v1 – Technical Manual Green Star SA – Green Building Council of South Africa 2013 (5)
Pages 107 to 133 of the manual are dedicated to the internal noise parameters to be met to gain points towards the buildings Green Star Rating. Three major points are addressed with other factors mentioned, but which will not gain any points. The two major points are:
1. Building Design.
The manual names SANS 10103:2008 as a reference for the performance requirements of the spaces in the building and their corresponding maximum sound levels. It requires 95% of all nominated areas to comply with the standard, where nominated areas are described as occupied spaces. Educational spaces are highlighted to also meet the requirements, and a point is gained by achieving this.
2. Overall Building.
Again SANS10103:2008 is the benchmark to meet the requirements. 95% of all nominated (occupied) areas are to comply with the standard. Educational spaces also benefit individually with a point if the requirement is met.
3. Educational Spaces (only).
Classrooms and lecture theatres are the only spaces that are required to meet a surface material or reverberation time performance criterion. One of two criteria is to be met to obtain a point.
The first is that an absorbent material with a Noise Reduction Coefficient (NRC) of 0.7 or higher to be installed on surfaces that are equal to or exceeds the total surface area. For example, if the surface area of a classroom ceiling is 60m2, the material must be applied to 60m2 or more. If it is not possible to install this material across the whole ceiling due to structural obstacles, the walls or floor need to be treated with a material that meets the NRC performance.
The second requirement provides a reverberation time of 0.8 seconds or less for classrooms and small lecture theatres, and a time of 1 second for large lecture halls. To determine the reverberation time in the space, the procedure dictated in ISO 140-4:1998 (6) needs to be carried out. Here is the procedure quoted from the standard: “The minimum number of decay measurements required for each frequency band is six. At least one loudspeaker position and three microphone positions with two readings in each case shall be used.” Seeing as this manual was first published in 2013, it can be seen why ISO 140-4 was used, but if it were to be revised this reference would have to be replaced by ISO 16283-1:2014 (7), which replaces the previous standard.
The manual makes provision for both pre-existing buildings and newly proposed buildings which allows “as-built” structures to make improvements to meet the requirements of the Green Building Council. A detailed report that provides the results of tests conducted, acoustic performance treatments applied, and methods used from relevant standards, is to be submitted by a qualified acoustic consultant. This report will be used as reference when the building owners submit the final application for the structures Green Building Rating.
In the Background section of the Internal Noise chapter, it provides an overview of what determines the ambient noise levels. The indices used to measure ambient noise is briefly explained and the effect on long-term exposure of high levels is outlined. The World Health Organization reference is made, but no indication made of as to the exposure limits.
1.4 – Conclusion
In South Africa, the available documentation for acoustics in classrooms shows that there is an awareness that environmental and building acoustic conditions are important. The depth of information is lacking and thus results in poor implementation and compliance. In comparison to other countries, additional standards and guidance can be implemented by local authorities to the uplift the quality of educational spaces. A study was conducted by Coralie Van Reenen, “Acoustics in South African classrooms: Regulations versus Reality” (8) in 2021. Page 3 and 4 of the study addresses the accepted standards and legislations that are in place in other territories. South Africa can take guidance from these examples to also put in place more detailed documentation as official requirements for new and currently operating educational facilities.
Part 2. Acoustic field measurements of classrooms.
2.1 – Introduction
Statista Research Department (9) posted that in 2022 that there was a total of 24,871 registered schools in South Africa. Only 2,282 are independent, or more commonly known as private schools. The remaining 22,589 schools are public schools. The majority of the public schools rely solely on government funding, and only a few public schools have a School Governing Body (SGB) that requires additional school fees of the parents and caretakers to provide better infrastructure for the learners. The independent schools do not receive any government funding and income is solely based on school fees. With the current economic climate in South Africa, functionality outweighs quality. Good acoustics is perceived as a luxury and is almost never on the agenda of future development. Quality research and actionable data could motivate local government to pay more attention to the development of acoustics in schools for the learners and teachers benefit.
2.2 – Objective
The aim is to take field measurements of existing classrooms of schools in South Africa to determine the quality of the internal acoustic properties as well as the ambient noise levels of the unoccupied spaces.
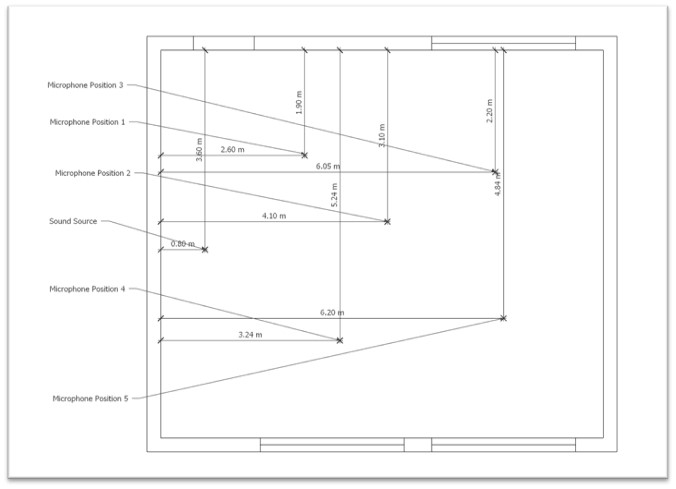
To measure the internal classroom properties tests will be conducted according to BS EN ISO 3382-2:2008 (10). A survey method shall be used for number of microphone and source positions. A higher number of source and receiver positions will be used if the circumstances allow. The sound source shall be positioned at the usual teaching position, and the microphones positioned in areas where the learners are normally seated. The measured reverberation time results will then be used to calculate other metrics such as Absorption coefficients and Speech Transmission Index (STI).
Unoccupied ambient sound levels will be recorded to measure the background noise level. Recorded and calculated results will be compared to the DoE Schools Act and SANS 10103 to evaluate compliance.
2.3 – Overview of schools selected for testing
Permission was obtained to conduct tests at three schools. Two are public schools and one is independent. Due to this report being of an educational nature, measurements were taken outside of normal teaching hours. Although the headmasters were very accommodating, and care was taken not to disrupt teaching schedules. All schools were located in the greater Johannesburg area.
School A
The first facility is a public primary school, that caters for Grades 1 to 7. This school was built in 1974 and opened its doors in 1975. The original structure that was fully completed in 1976, stands relatively unchanged, with only a couple of minor alterations and additions.
School B
The second facility is a special needs school, primarily concerned with deaf pupils. It is a public school that was built in 1934 by local government and established as a school for the deaf children in the province. The school caters for learners from pre-primary up to high school.
School B
The third facility is an independent school that started in 1993, but only moved into the current property in 1997. Originally only a primary school, they opened for high school students in 2003.
2.4 – Geographical Information
School A is surrounded by residential housing, mostly single storey houses. There is a busy motorway that is roughly 250m away, southeast of the school property. This is a likely noise source during the day for the school. On the opposite side of the motorway there is a commercial area with large business properties. This area is mostly for retail shopping and very little manufacturing, or other potential noisy activities occur in this area. An international airport is situated roughly 7km towards the east of the school boundary. Annex B.1.1 shows geographical properties surrounding the school. Majority of the school’s boundary wall is metal palisade fence. Permission was granted to conduct tests during the school’s winter holiday break, as to not disturb teaching timeslots.
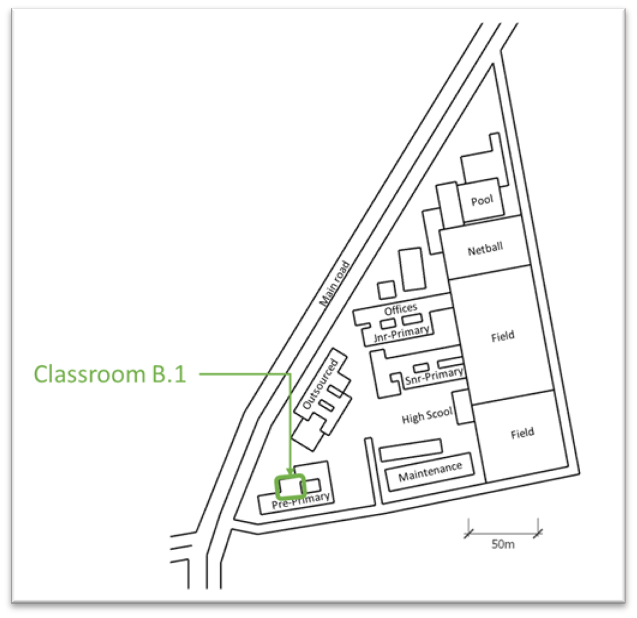
School B is located on the border between a residential and commercial area. There is a busy main road that runs parallel to the school’s west border. On the other side of the main road is a commercial business district with offices and retail shops. To the east of the school there is a large residential area. Annex B.2.1 shows the geographical location and surrounding areas. The school granted opportunities to conduct tests late afternoon after school hours.
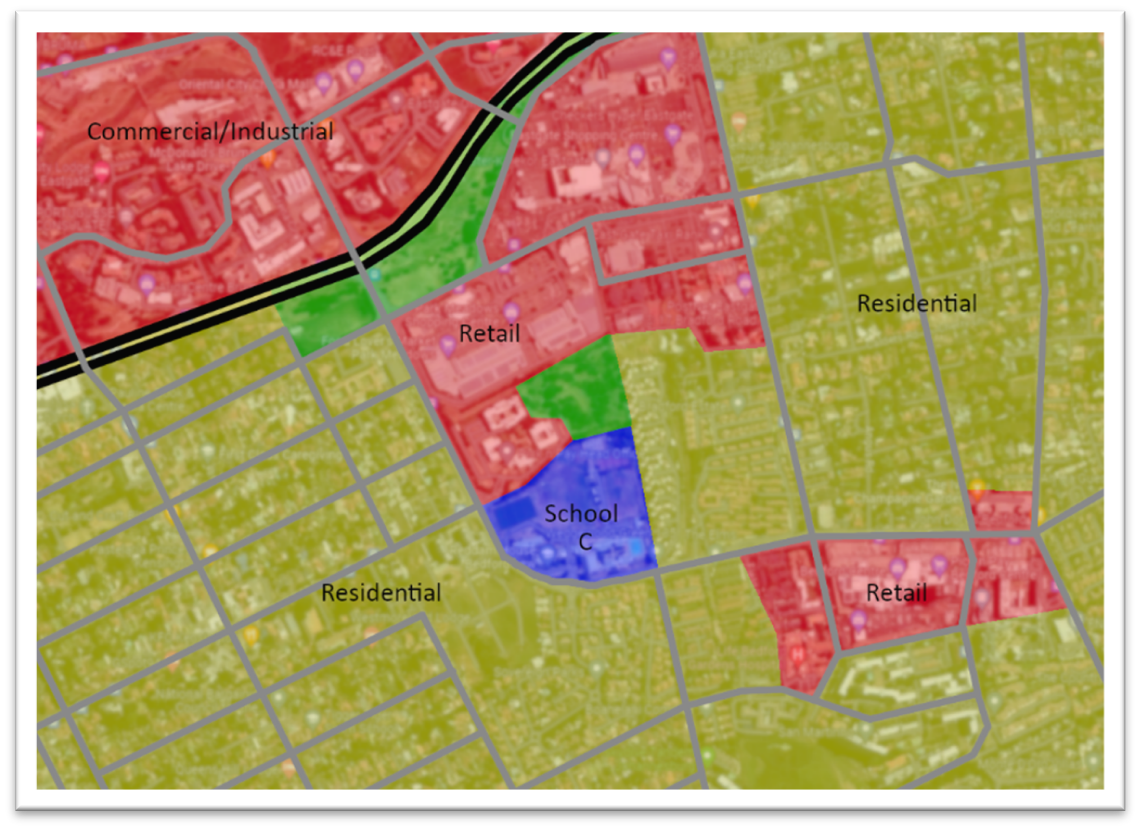
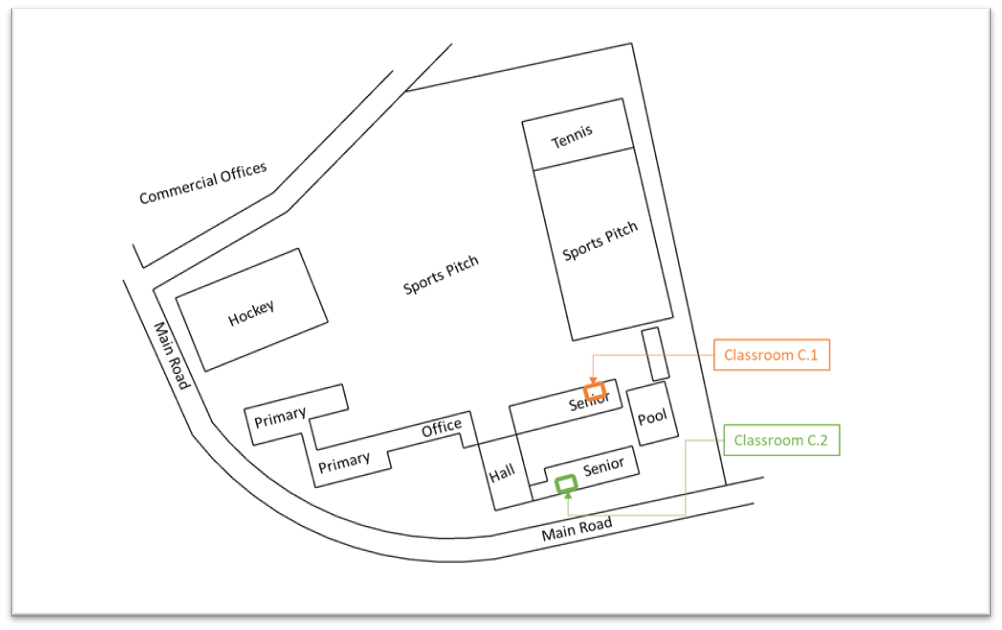
School C is situated on the border of a residential and commercial area. There is a motor way roughly 500m away and the West and south border of the school property is adjacent to a main road. Annex B.3.1 indicated the geographical location and surrounding areas. Test were conducted late afternoon after school hours. There were multiple sport matches being played on the surrounding fields.
2.5 – Classroom properties
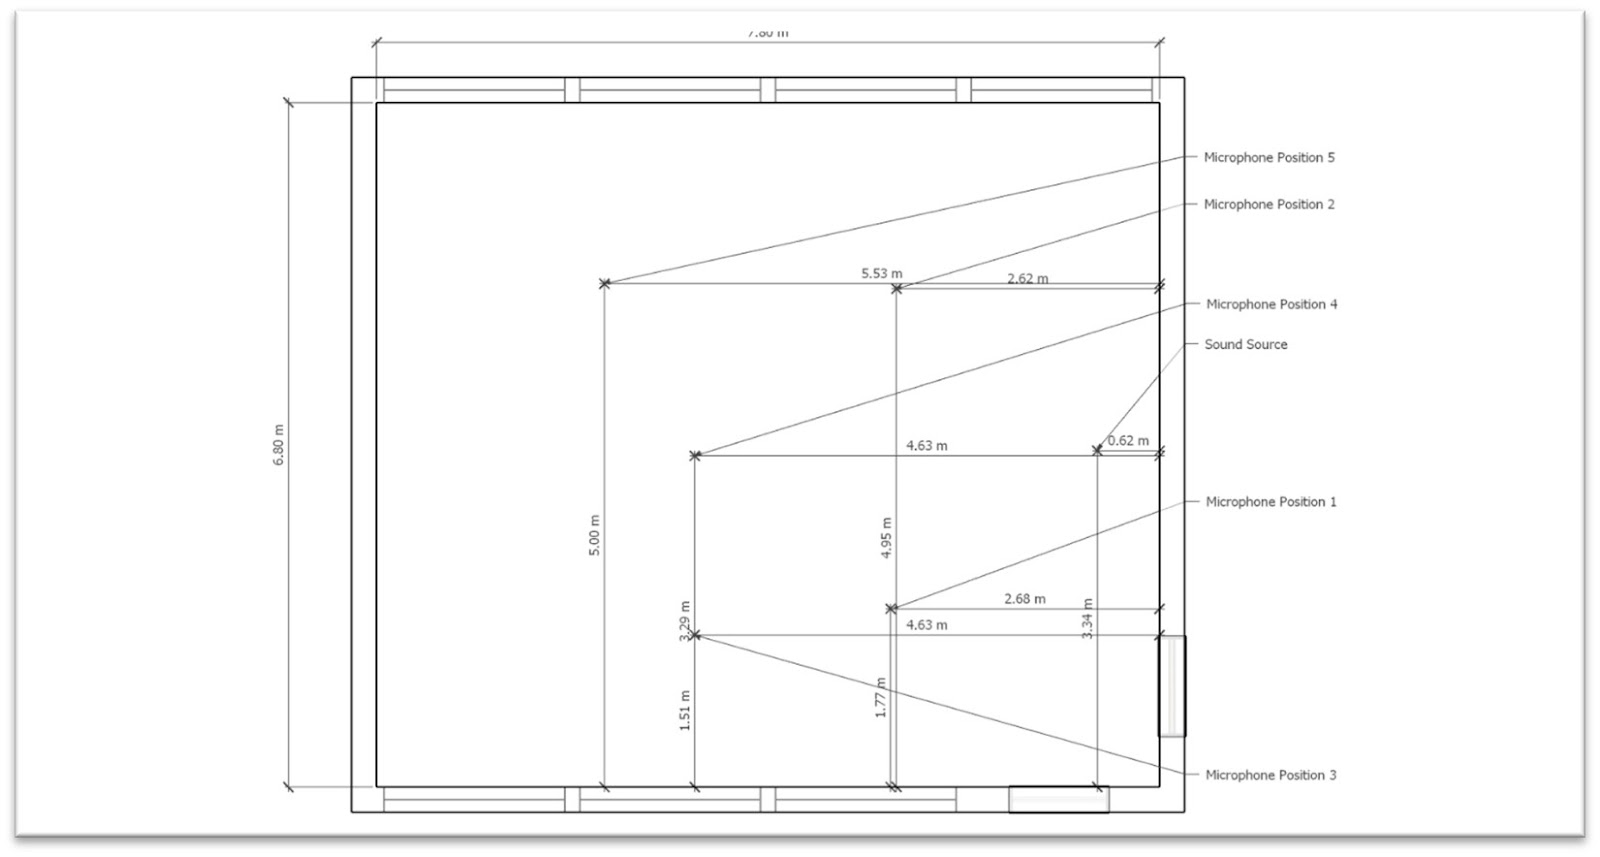
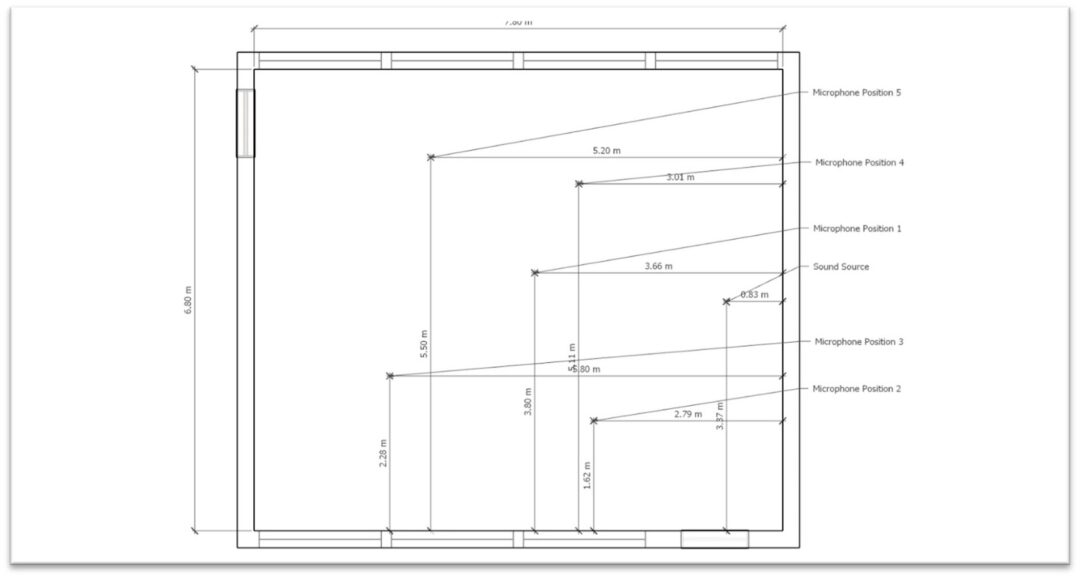
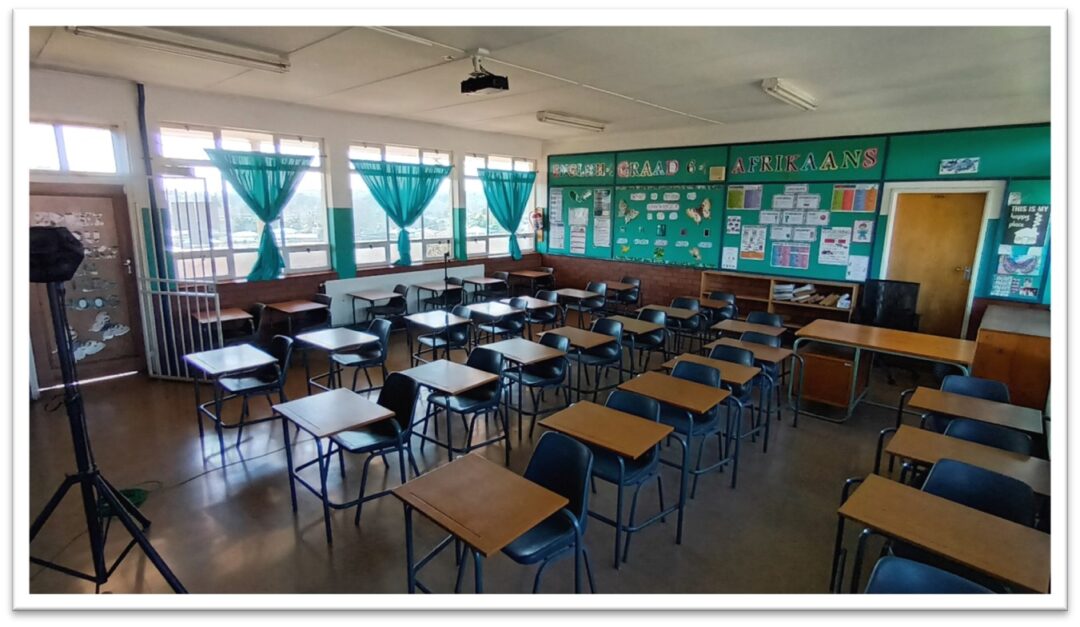
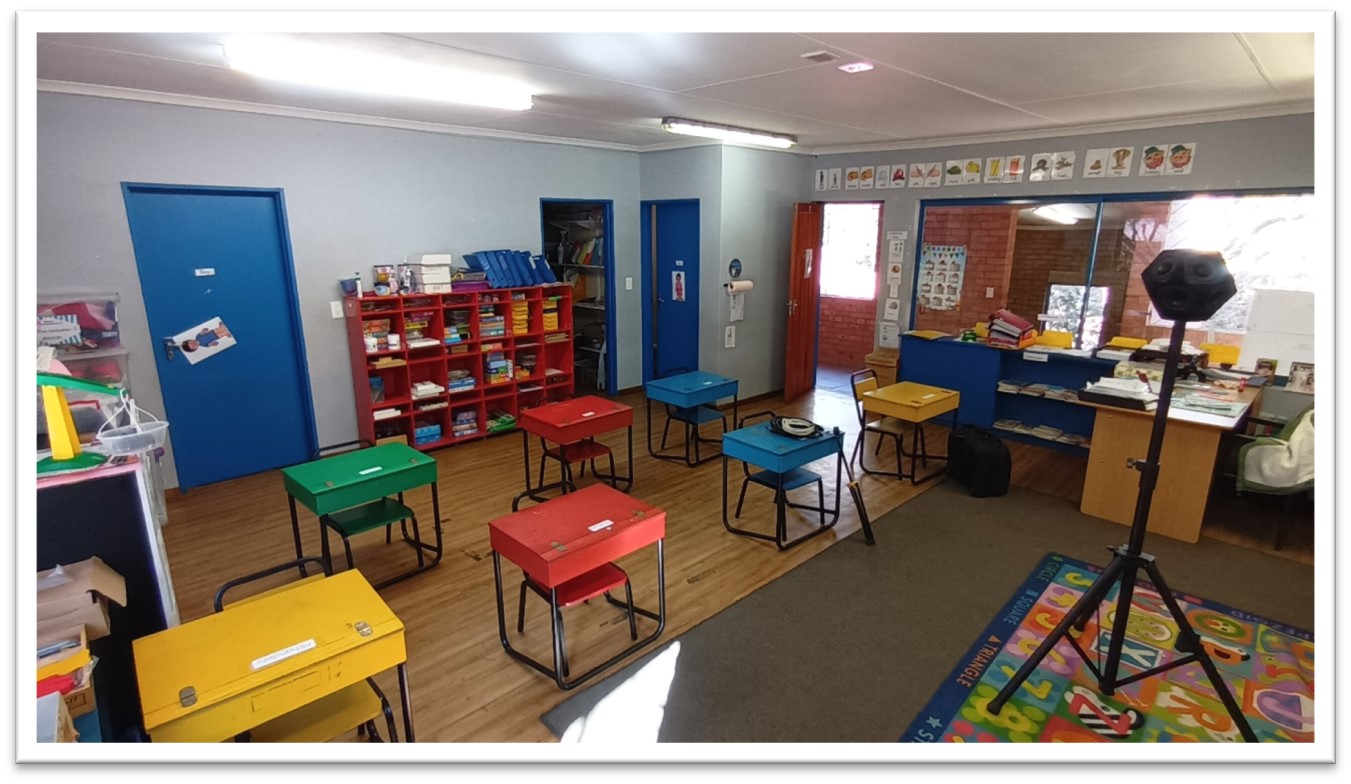
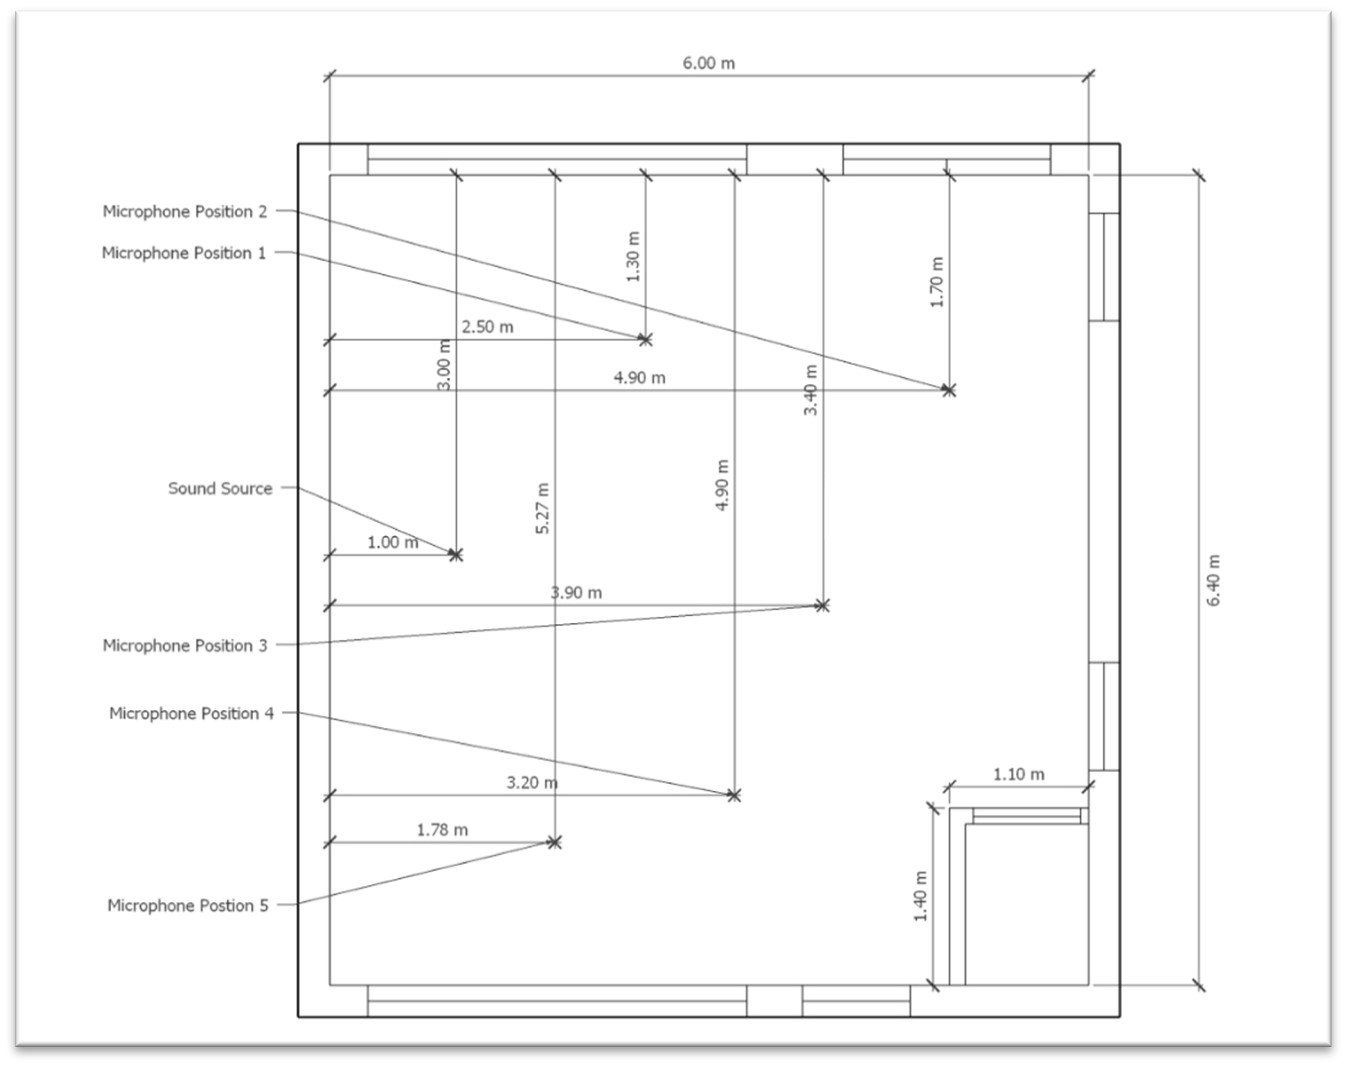
Annex B provide dimensional diagrams of the classrooms with photographs. Table 2 below provides dimensional characteristics of the measured classrooms.
For School A the senior primary block of classrooms was made accessible for testing. This block has three levels, and one classroom per level was chosen for testing. All the classrooms are nearly identical in size and layout. The floors are covered in adhesive vinyl tiles. All classrooms that are located on the top floor of a structure, has gypsum board ceilings attached to the wooden roof-beam structure. All classrooms that have a floor above them has an exposed concrete slab ceiling. The north and south facing walls are mostly windows. The East and West facing walls are either covered with corkboard or has a chalkboard and projection screen mounted on it. No obvious attempt has been made to improve the acoustic conditions of the classrooms.
Only one classroom was available for measurements at School B. This was a Grade R classroom located on the first floor of the pre-primary block. The classroom has gypsum board ceilings and cement plastered walls. The front section of the vinyl tiled floor has a large carpet (3.3m x 2.5m) laid down. The classroom has four single solid wood doors. One leading to the corridor landing and the other three to internal storage rooms and one toilet. It also has a double wooden door leading to a patio that is used for eating times and play. There are two large windows, one north and the other south of the room. None of the walls have any covering apart from educational posters. If there is absorbent material in the ceiling is unknown. The floor space is not a conventional rectangular shape and is broken by a bathroom that takes up 1.1m x 1.4m of the classroom space.
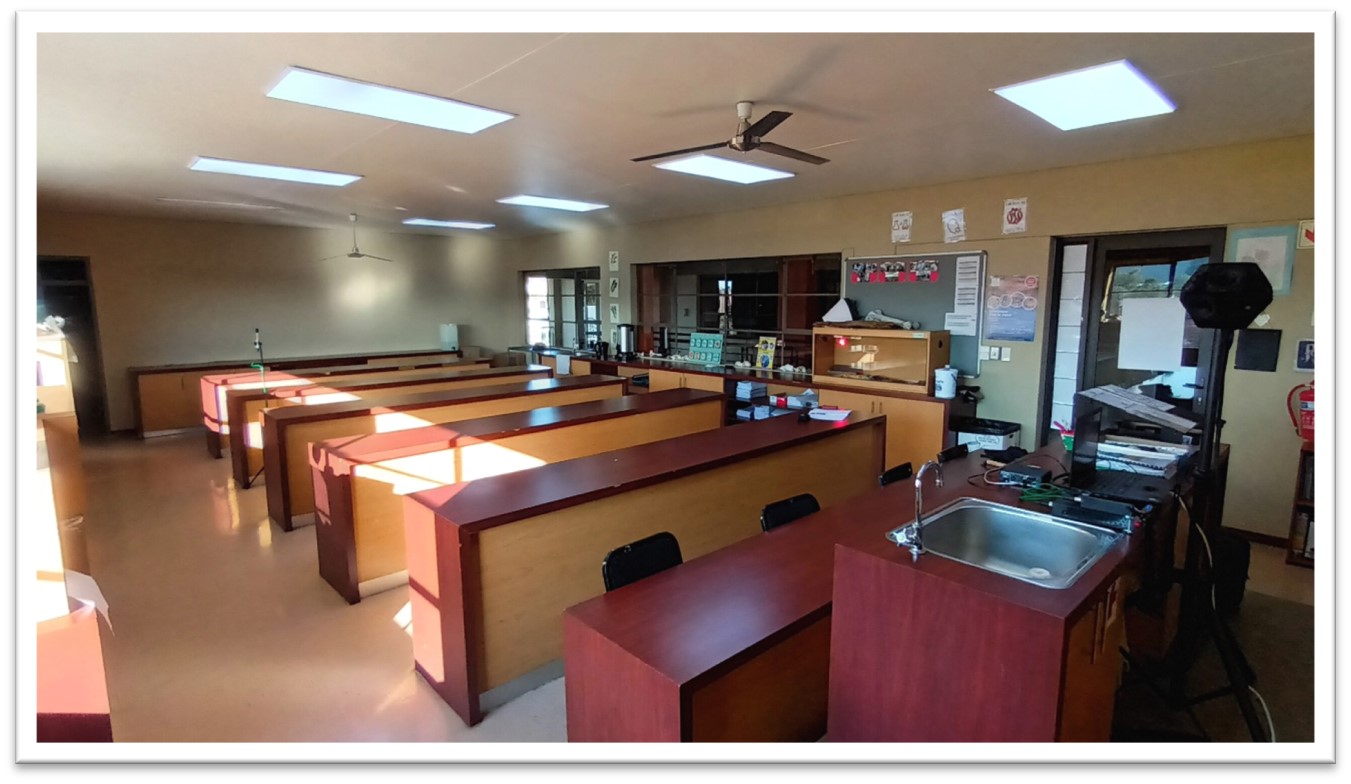
School C allowed access to two classrooms in their high school block. The first was a science classroom on the first floor and is larger than a standard classroom. There are counter-high rows of permanently fixed tables. The teaching position is on a hollow raised platform 0.2m above the floor. The floor is covered with vinyl tiles and the ceiling is standard gypsum board. There is no knowledge of sound absorption in the ceiling. There is one door that is the entrance from the corridor into the classroom. Another door that is solid wood leads to a storage room. There are 4 large windows, two on the south walls and two on the north wall. The remaining walls are cement plastered with only educational posters covering small sections.
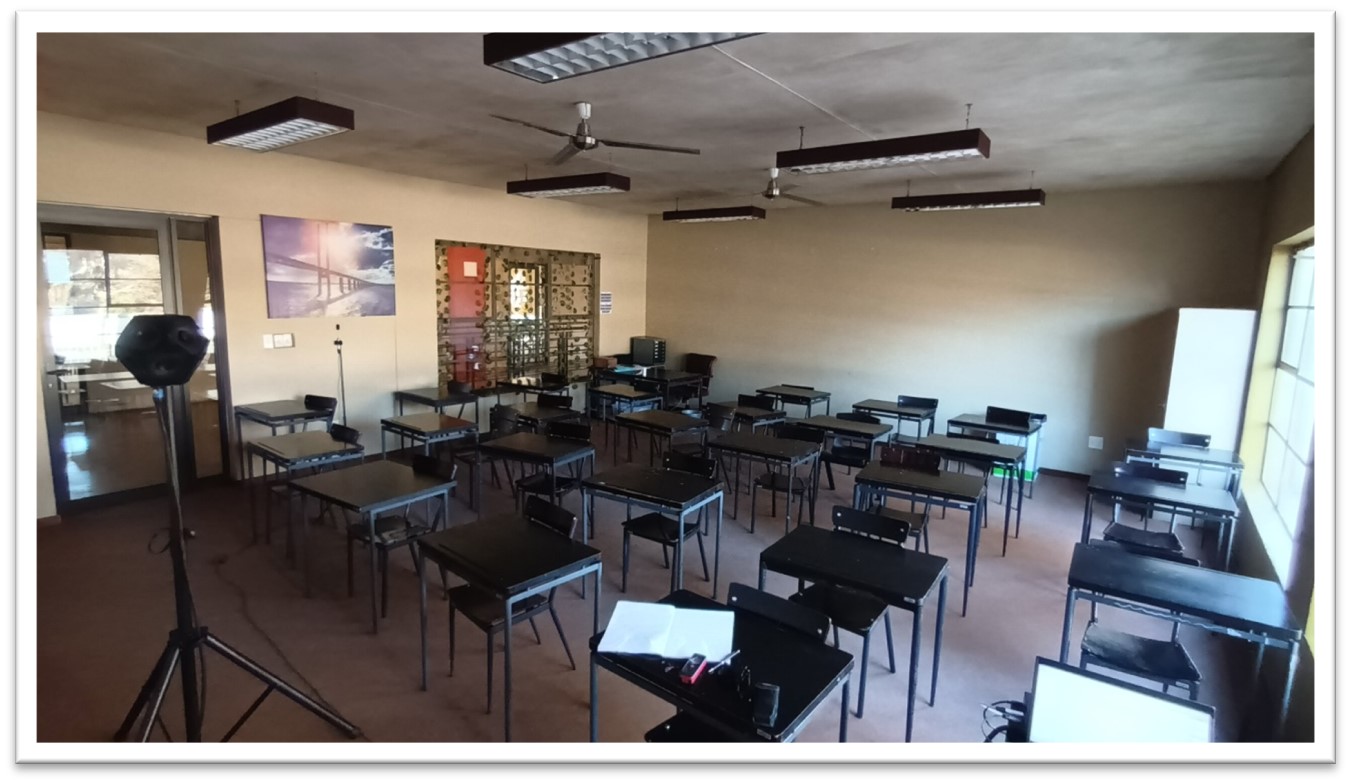
The second classroom was a conventional classroom on the first floor. The floor is covered with high-traffic carpet and the ceiling is standard gypsum board. There is one glass door that is the entrance to the classroom from the corridor, and the room has three large windows. Two windows on the south wall and one on the north wall. The walls are plastered cement with no covering, only educational posters.

All classrooms accommodated for 30 students. Apart from the science lab (C:2), similar steel frames with wooden top tables were positioned in aligned rows for students as desks. School A and B classrooms had a video projector and large white screen at the front of the class. School C classrooms were both fitted with flatscreen TV’s. No audio amplification systems were installed in the classrooms and teachers relied solely on vocal effort for teaching. Although not part of this study, no visible attempt of sound insulation between the classrooms has been included in the design and fittings of the rooms. Additional test would have to be conducted.
2.6 – Measurements and results
Acoustic tests with calibrated equipment were conducted in the classrooms. Annex C provides details on the equipment used. Procedures, calculations, and guidance were used from international standards to carry out the measurements so that they are accurate and repeatable. Standards used will be mentioned in each section below.
2.6.1 – Ambient Noise Levels
External noise can hinder concentration in the classroom. Many factors such as nearby roads, corridor noise and building services can contribute to the overall background noise experienced by learners. Ambient noise level measurements were recorded with an unweighted 1-minute equivalent continuous level (Leq,1min). For each classroom five measurements were captured, and the average levels were calculated. The averaged results can be seen in Graph 1 below in comparison between the six classrooms.

At all the same measurement locations the octave frequency band ambient noise levels were also recorded from centre frequency bands from 125Hz to 8000Hz. Tonal characteristics, where certain frequency bands are louder than others, can be a more prominent distraction that broadband noise. The results per classroom were averaged together per octave band and are plotted on a Noise Rating (NR) Curve on Graph 2 below. NR values are taken from BS 8233:2014 (10) and are used to determine the ambient noise levels in rooms, specifically in relation to building services noise and sound insulation from external factors.

2.6.2 – Speech Transmission Index
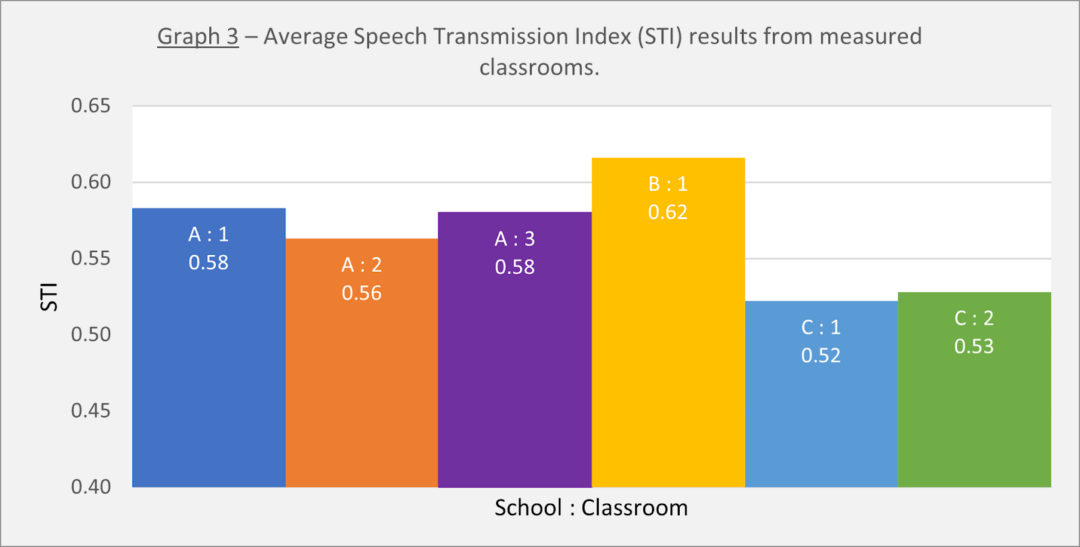
An objective measurement of how well human speech is understood within a space is called the Speech Transmission Index (STI). This has a rating scale of 0 to 1, where 1 is very good and 0 is unintelligible. BS EN 60268-16:2011 (11) in Annex G, recommends a minimum STI score of 0.62 for classrooms. Using a software-based measurement tool, STI levels were calculated at five locations per classroom and averaged together. Graph 3 below shows the calculated average STI scores of the six classrooms.
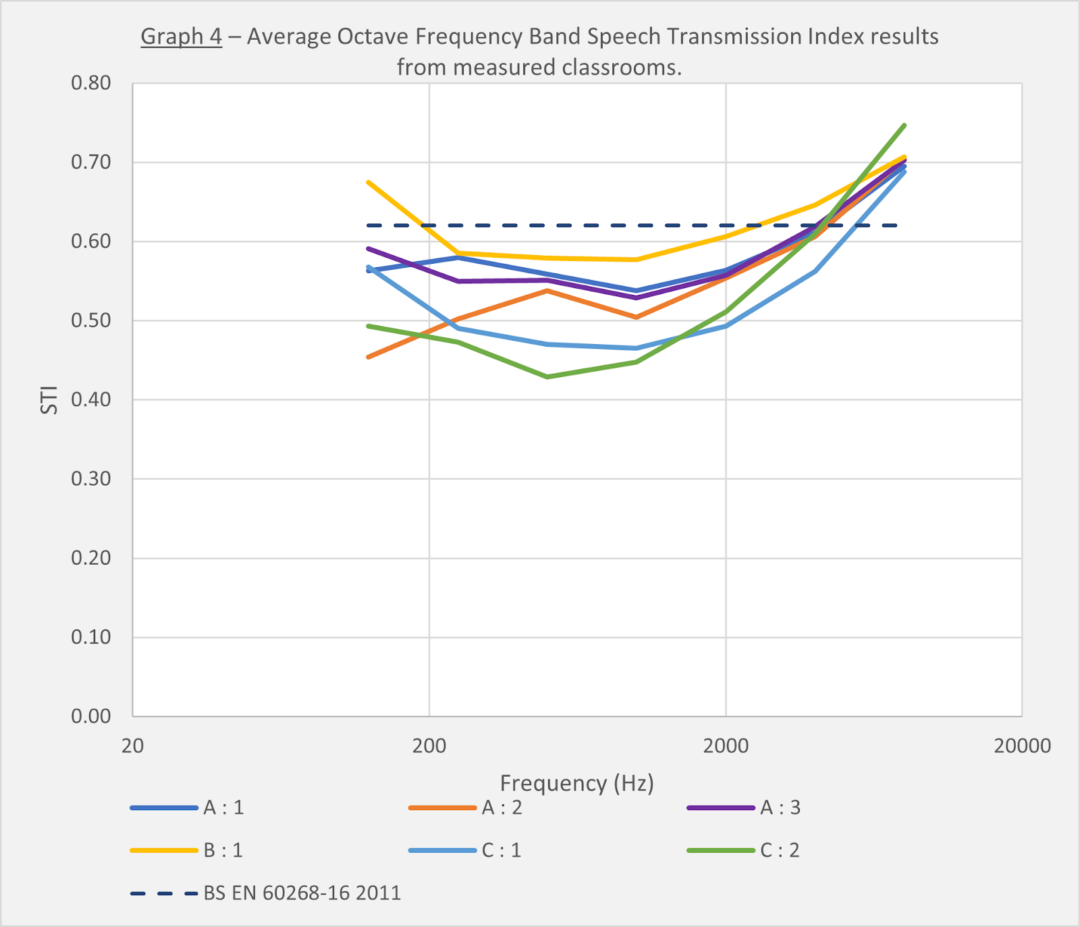
At the same locations octave frequency band STI measurements were also recorded. Graph 4 below displays the six classrooms and the corresponding STI score. The recommended STI score from BS EN 60268-16 has been indicated on the graph as a reference.
2.6.3 – Reverberation Time
When a soundwave is incident on a surface it can interacts with that surface in three ways. When the surface is hard sound is reflected back similar to a mirror reflecting light. The sound wave can be absorbed if the surface is porous, converting the sound energy into heat. Lastly it can be transmitted through the surface if the density of the material is not enough to either reflect the sound back or if it is not porous enough to absorb the sound wave. All three reactions can occur, and the amount of each reaction is dependent on the surface material. When sound is reflected back into a room multiple times the sound energy decays at a rate of decibel loss in seconds until the sound energy has returned to normal state. This is known as the Reverberation Time property of the space. ISO 3382-2 (12) provides procedures to measure and determine the reverberation time of an ordinary room. For the classroom measurements a survey method was chosen. The survey method requires at least one sound source location and at least 2 microphone positions. Five microphone positions were used with two measurements per microphone position. These were averaged together, and Graph 5 below shows the averaged results compared between the six classrooms. An interrupted noise method was used to capture the results. The sound source was a pseudo-random pink noise with a FFT window size of 5 seconds. Smaart software was set to take 4 averages per measurement.

At the same measurement location, the octave frequency band reverberation time was also captured from centre frequency bands from 125Hz to 8,000Hz. A well know formula (F3) from Stephens and Bate (13) to determine the optimal reverberation time, was used as a reference to compare the measured results from the classrooms. The optimum recommended classroom floor space of 60m2 from the Schools Act was used to calculate the optimum recommended reverberation time. Graph 6 below show the averaged results from each classroom in relation to the Stevens and Bate curve.

2.6.4 – Absorption
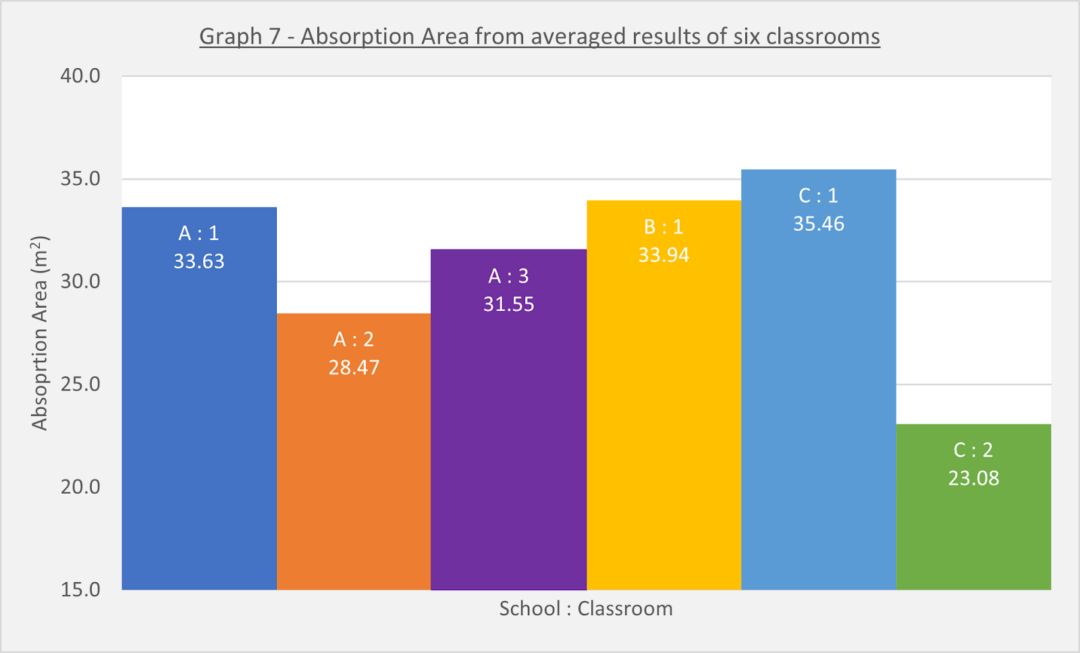
If a surface is completely absorbent it means that all sound energy incident on that surface is converted to heat energy, no energy is reflected or transmitted through. This is not the case in common rooms and surfaces have a ratio of absorption. This ratio is known as the Absorption Coefficient (α). The total Absorption Area in m2 can be calculated if the coefficient of the surface material is known, or if the reverberation time is seconds is known. Graph 7 below shows the calculated Absorption Area of each classroom using the averaged reverberation time and the Sabine formula (F1). If the surface material has a higher Absorption Area the reverberation time will decrease, improving speech transmission. Table 1 in Part 1 has a calculated optimum Absorption Area based on the criteria set out by the Schools Act.
Surface treatment with various thickness and or densities will have corresponding effects on the absorption of the sound’s frequency response. Graph 8 below shows the absorption coefficient calculated from the averaged measured results, using Formula 2 for each octave frequency band. A thick, porous absorber or tuned panel absorber will have a higher absorption coefficient. The absorption ratio is measured from 0 to 1, where 0 equals no absorption and 1 is total absorption.

2.7 – Discussion of results
Ambient noise levels
All measurements were taken when the classrooms were unoccupied and outside of teaching hours. Subjective assessments yielded no obtrusive building services noises, apart from classroom B:1 which had high frequency buzzing florescent light tubes. None of the classrooms had air ventilation or air conditioning units. This classroom had slightly higher anticipated noise pollution from the main road that passes next to the school boundary, but it was lower than expected. The lower level could possibly be attributed to the 4m high wall on the boundary of the school where the main road runs parallel. School A classroom 1 and 2 had very low recorded noise levels. Subjectively there was no environmental noise from surrounding influences. Occasionally airplane noise could be heard from the nearby airport, but no record of flights per hour and sound levels were recorded. School-A classrooms are located right next to the large sports field. The only activity on the fields during teaching time is the Physical Education class. This would have an impact on the environmental noise for this block of classrooms. Classroom A:3 noise levels were recorded higher than normal due to high pressure hose cleaning that started up, interrupting the test procedures. School C’s classrooms all have enclosed passageways between two rows of classrooms. These passageways have no acoustic treatment and the break-in noise into the classrooms is very audible and can be distracting if students are in the passages during teaching time. Classroom C:2 recorded high ambient noise levels due a main road adjacent to the first-floor classroom.
Speech Transmission Index results
Classroom B:1 was the only room that measured an acceptable STI score of 0.62. This is the minimum recommended score as per BS EN 60268-16. None of the other classrooms passed the minimum requirements.
Reverberation Time
The range of recommended reverberation time of 0.6 to 0.8 seconds by the Schools Act was only met by one classroom, B:1. All the other classrooms had average reverberation results of higher than 0.9 seconds.
Absorption
None of the classrooms had any visible attempt to improve the acoustic conditions. Classrooms A:1 and A:2 both had exposed concrete ceilings, with no treatment to reduce reflections. All the other classrooms were on top floors, had standard gypsum board ceilings. It is assumed that minimal temperature control material would have been installed, but it has little effect on absorption. School A was the only school where areas of the walls were covered. The main purpose of the cork walls was not to improve the reverberation time, but to attached educational posters to it. Due to the high traffic and hygiene, the hard floor materials are understandable, but it does contribute to the poor acoustic properties. It has to be mentioned that Classroom C:2 that had a totally carpeted floor, provided the longest reverberation time, even though it wasn’t the largest space. But this could be attributed to the room proportions being more cubic than the others.
2.8 – Conclusion
From the objective and subjective assessments of these schools and their classrooms, it is clear that there was no consideration for good acoustic design. All materials used were of a generic nature with little to no acoustic benefit.
Due to South Africa’s climate, the need to insulate the classrooms for very cold or hot weather conditions is not a high priority. The most common air conditioning unit is either opening or closing a window. This has adverse effects on insulating the rooms for break-in noise and transmission of sound between classrooms. This does however lower the building services noise because there are none. Apart from Classroom C:2, the general ambient noise levels were acceptable, but this would have to be reassessed during teaching times to determine the impact of neighboring occupied classrooms, courtyards, sports fields, and corridors.
The internal acoustic characteristics can definitely benefit from improvements. Graph 10 below shows the improvement in reverberation time of the two classrooms that have the exposed cement slab ceiling. If the Green Building Council’s requirement had been implemented namely to have the ceiling surface area treated with an absorption material that has a minimum coefficient of 0.7 the improvement would be substantial.
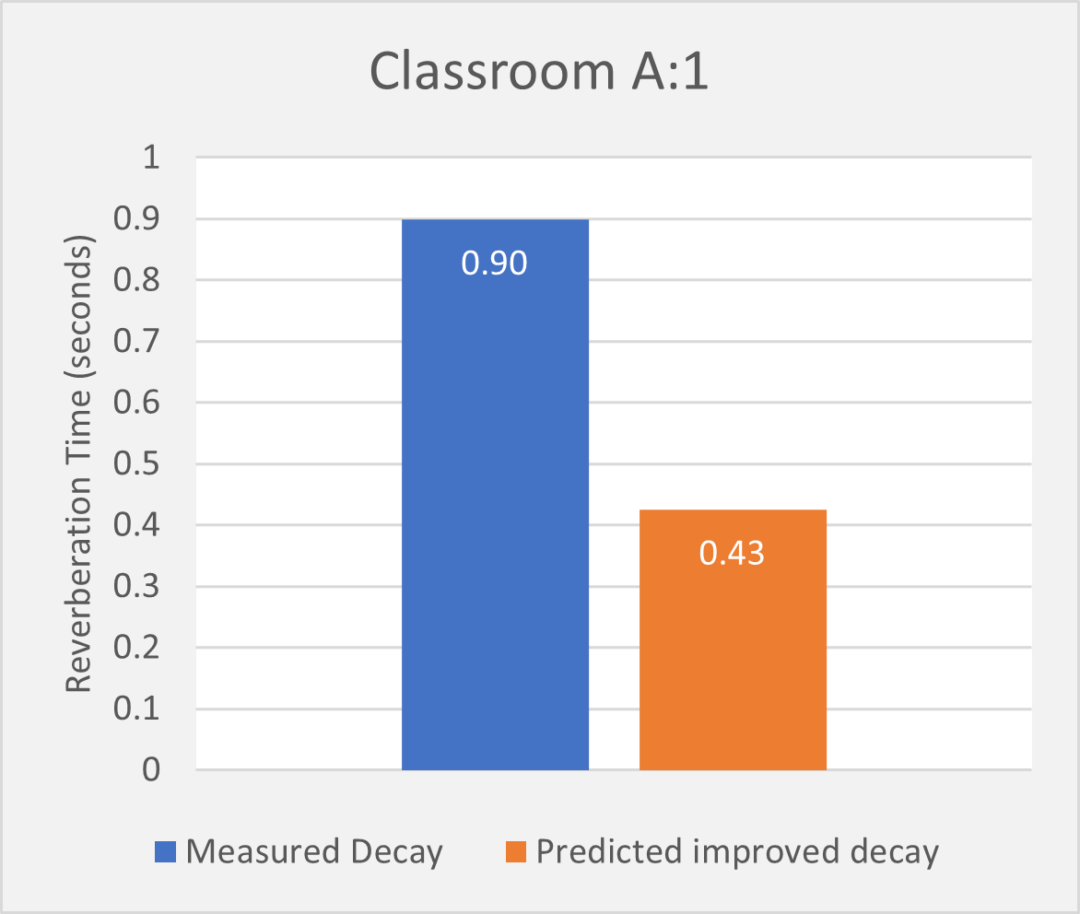
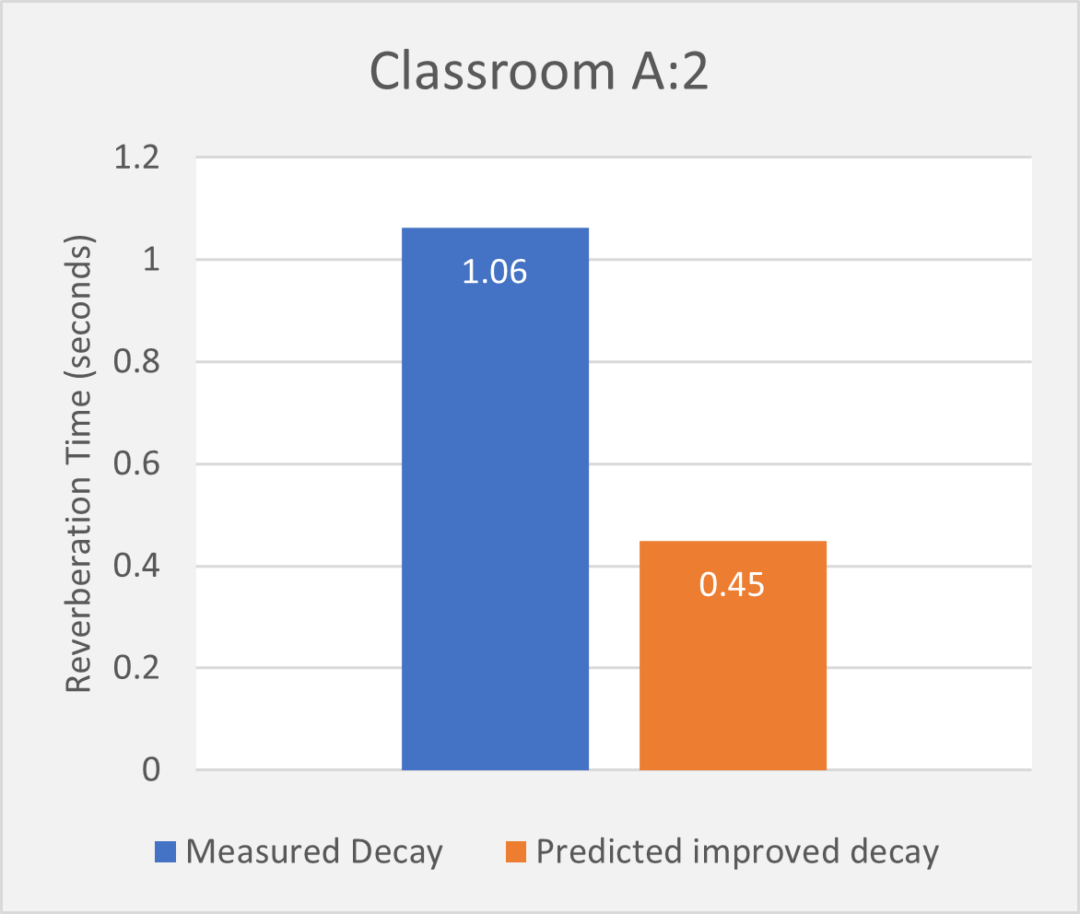
Graph 9 & 10 – Comparison of measured averaged decay times with predicted improved decay times based on ceiling area treated with an absorber with a minimum absorption coefficient of 0.7.
Part 3. Construction and testing of a DIY omni-directional loudspeaker.
3.1 – Introduction
To conduct acoustic measurements in a space, such as room reverberation or the sound transmission between two rooms, a sound source that produces an equal level over a wide frequency response in all directions is required. The most common sound source is a loudspeaker with transducers mounted facing all directions. There are three acoustic standards that have a paragraph dedicated to the minimum requirements of such a sound source.
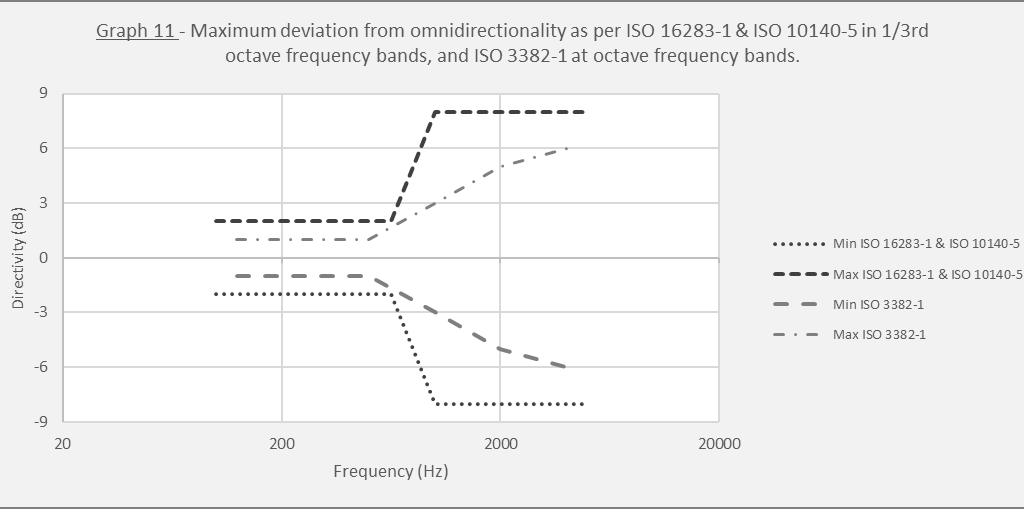
The requirements in paragraph 4.2.1 of ISO 3382-1 (14) has the strictest minimum and maximum deviation limits of the omnidirectionality of the sound source when being used for room reverberation tests. ISO 10140-5 (15) and ISO 16283-1 (16) are both standards used for airborne sound insulation testing between two spaces. The requirements for a sound source in these two standards are similar.
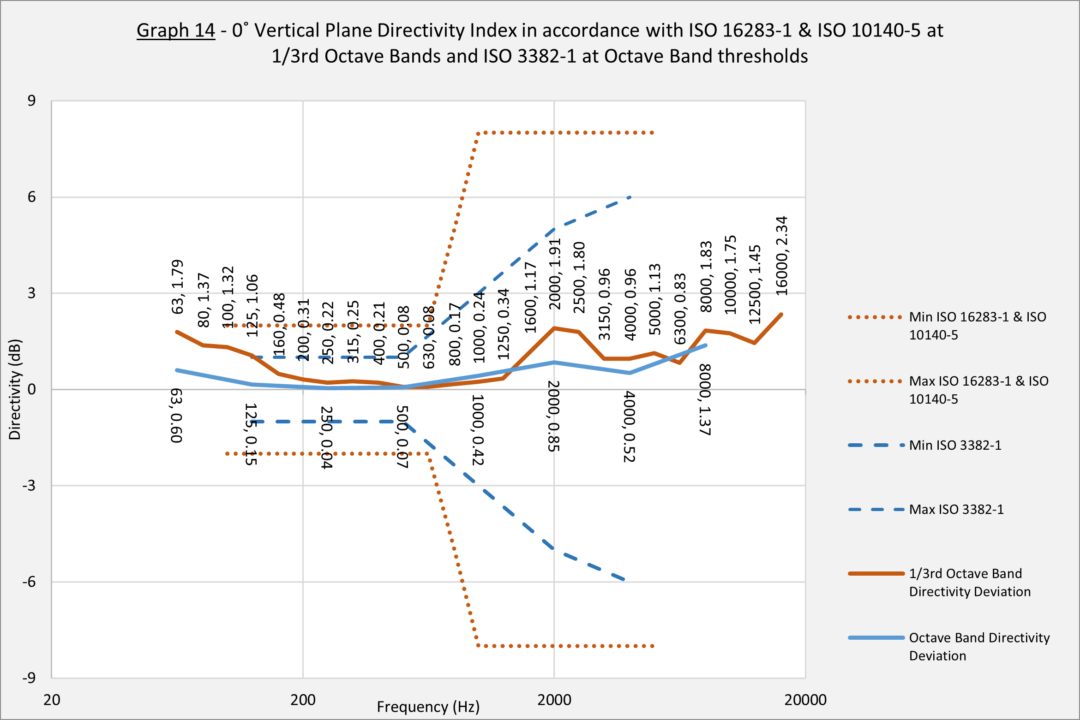
All three standards outline the same test procedure and calculation method to determine the omnidirectional directivity of the sound source. Graph 11 below displays these limits, and the deviations may not exceed these thresholds to meet the requirements of the standards.
3.2 – Objectives
Part 2 of this project requires an omni-directional sound source to assess the acoustic properties of classrooms. With limited access to an omnidirectional loudspeaker, resources at hand will allow the construction of such a device to accurately conduct the measurements.
The aim is to construct a polyhedron with twelve sides, also known as a dodecahedron, and to fit each side with a 4” (100mm) transducer that produces a full-range frequency response. The bottom side will have an accessory to mount it securely on a tripod. The remaining eleven sides will each have a transducer fitted. The test procedure provided in the three above mentioned standards will be executed on the loudspeaker to evaluate the deviation of its omnidirectionality. The measurements taken will also be used to construct Polar Frequency Response charts for both horizontal and vertical axial planes.
ISO 3744 will be used to determine the loudspeakers Sound Power Level (LW). ISO 3382-1 requires that the sound source has to be 35 – 45dB above the ambient level in the space being assessed.
3.3 – Design and construction
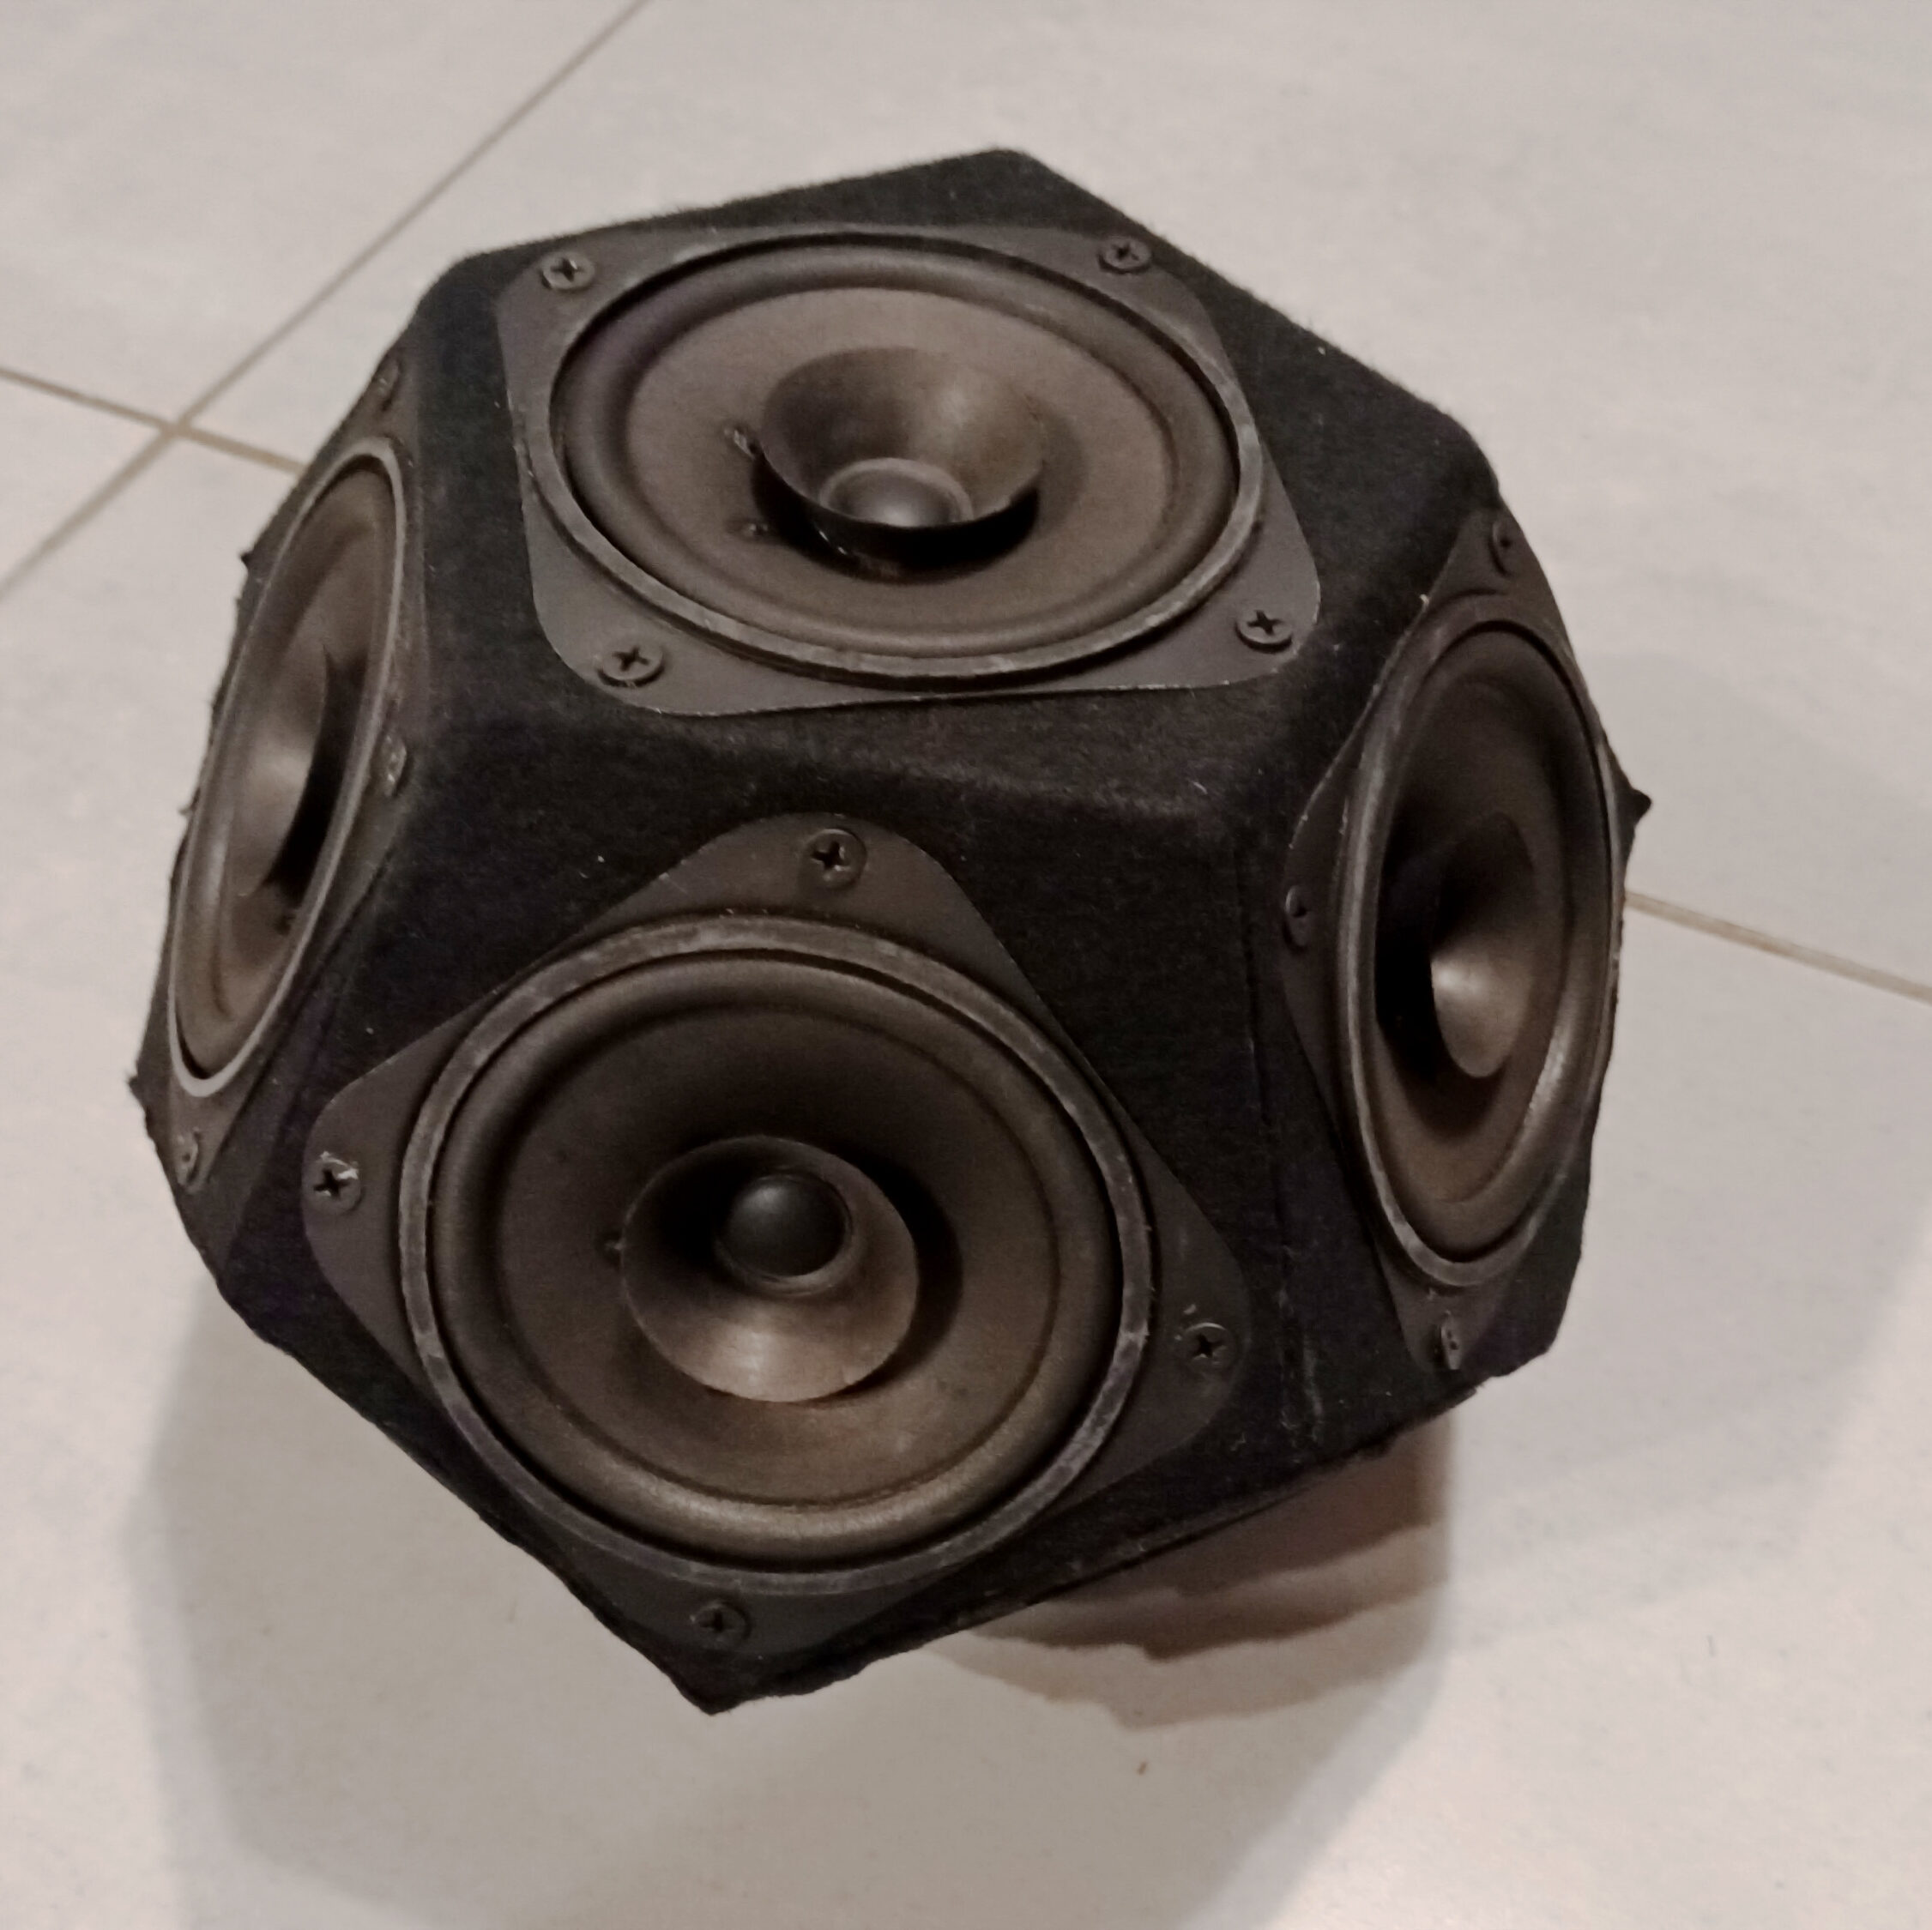
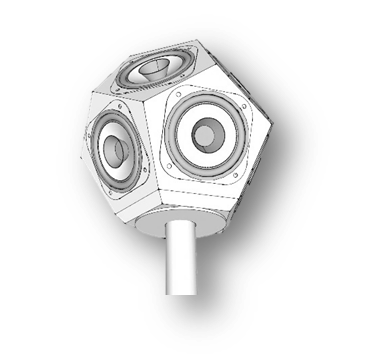
CAD software was used to design the dodecahedron enclosure. The enclosure was assembled with twelve pentagon pieces of 12mm plywood, nailed and glued together to create a rigged, air-tight housing for the transducers. One of the pentagon sides was used to mount a metal “Top-Hat” to safely secure the loudspeaker on a tri-pod stand. The enclosure was covered with black felt fabric.
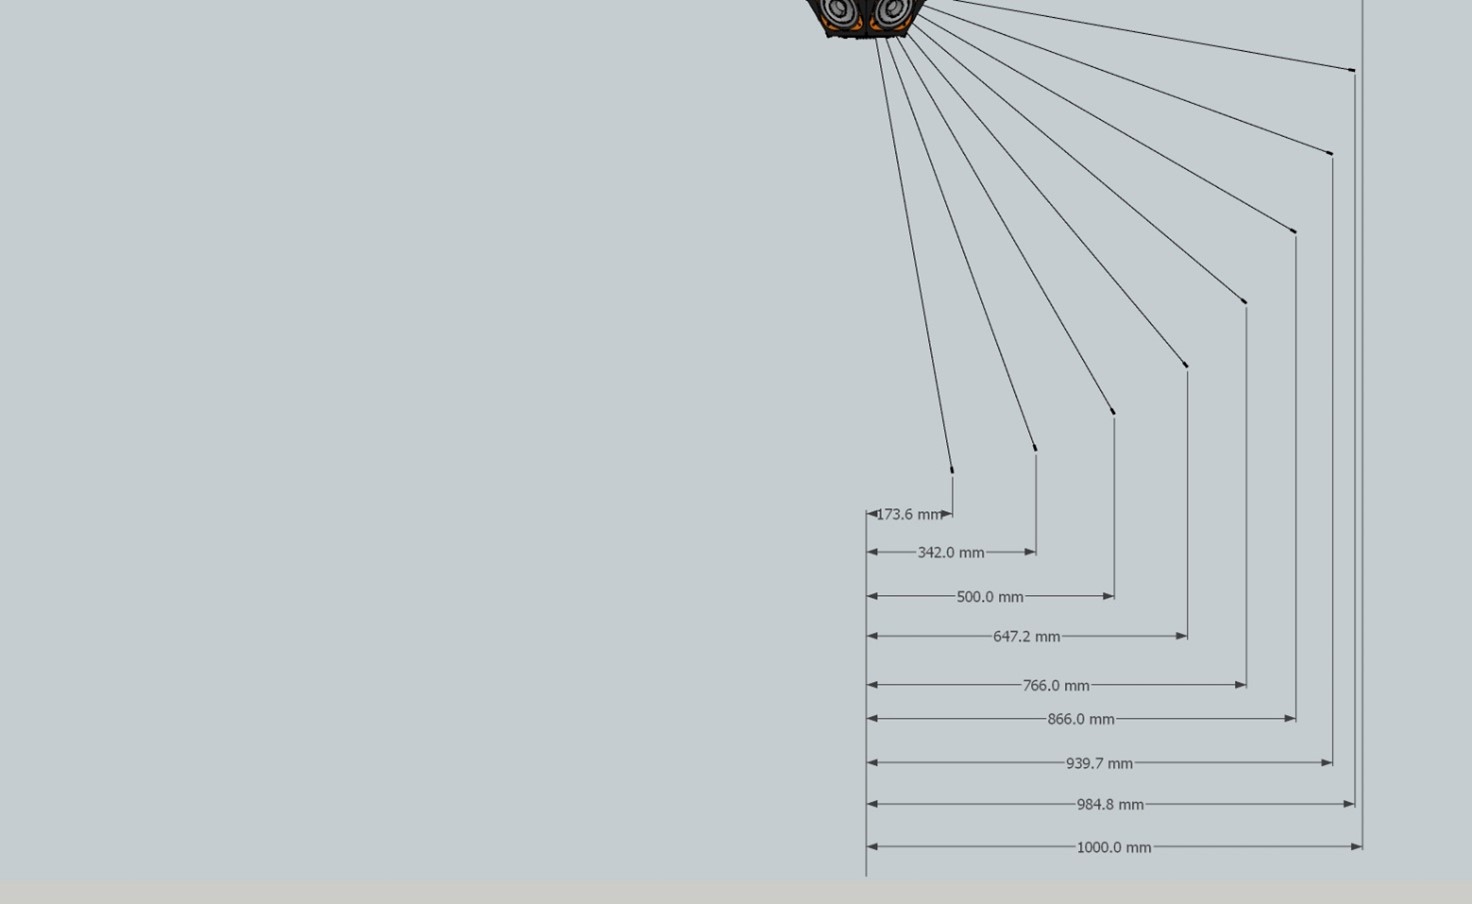
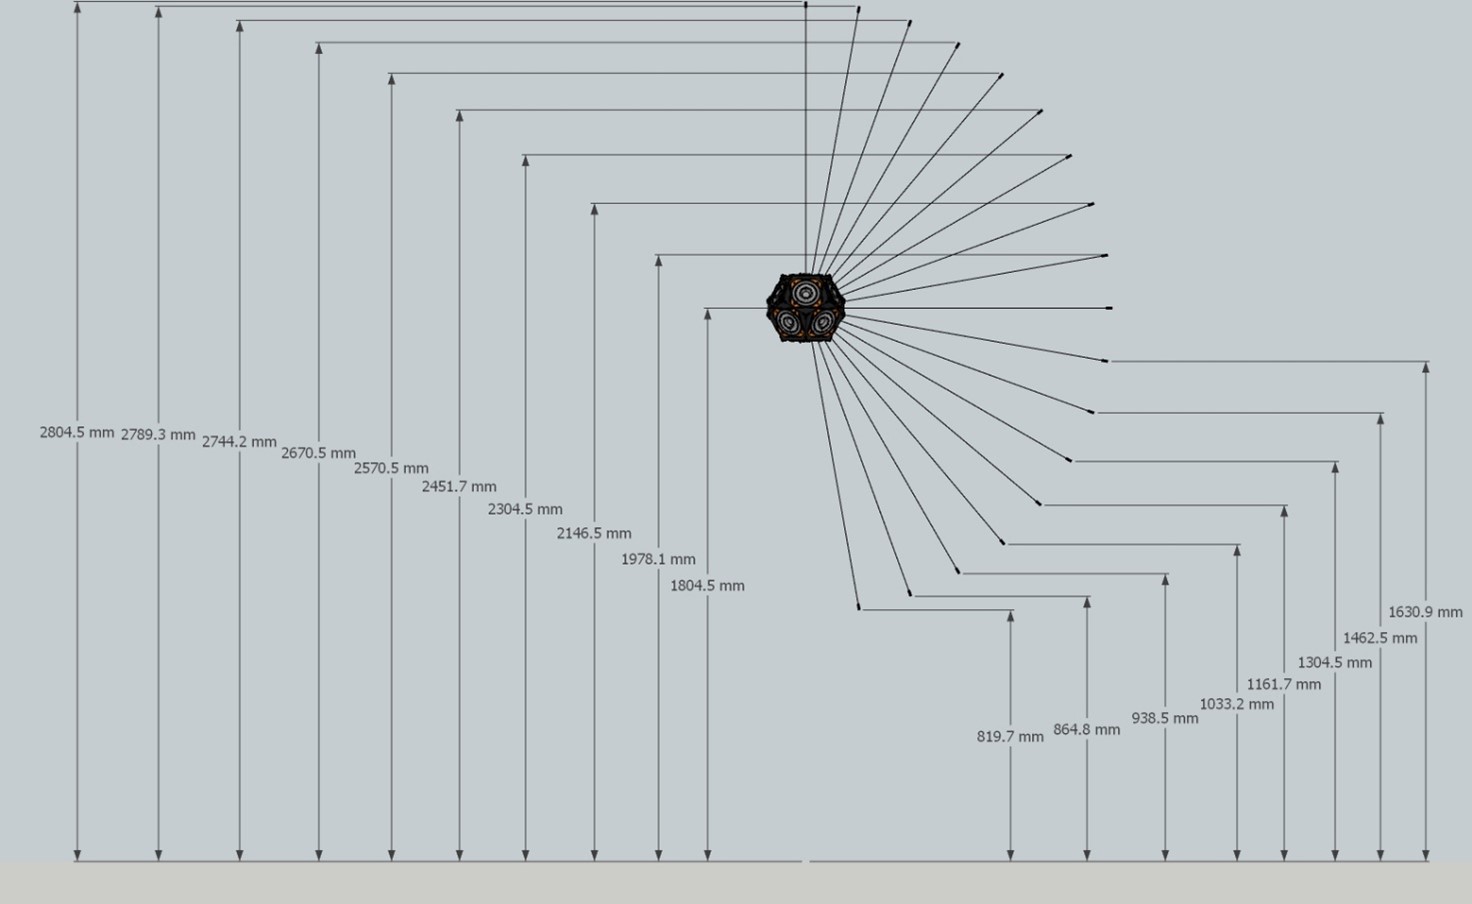
Image 1 below shows the modelled construction, Image 2 is an image of the finished product and Image 3 shows the mounting of the loudspeaker with installed top-hat on a tripod stand.

3.4 – Electronics
A stand-alone two-channel audio amplifier is connected to the eleven transducers using a 4-pole Neutrik SpeakOnTM twist-lock connector. Each transducer produces a full-range output with a sufficient frequency response from 63Hz up to 16000Hz. Six transducers at the top are wired in a series/parallel combination and connected to one channel of the amplifier. A resistor and the five remaining transducers are wired in a series/parallel combination and connected to the other channel of the amplifier. The purpose of the resistor is to have a similar DC resistance connected to each channel of the amplifier so that the load is balanced.
Diagram 1 below shows how the circuit wiring between the amplifier and the transducers is achieved.
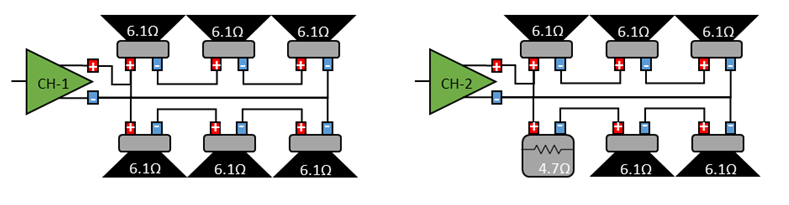
Each transducer has a Continuous Power Rating of 40W and a DC Resistance of 6.1Ω. Three transducers wired in series results in a DC resistance of 18.3Ω. Two circuits of three transducers wired in series, then wired together in parallel result in a DC resistance of 9.15Ω. The second channel that has one resistor and five transducers are wired in the same way, but the lower DC resistance of the resistor at result in a total DC resistance of (17). This small difference in resistance means that the two circuits produce a small output level difference but could be rectified on the digital signal processor, with level attenuation of 0.7dB on the top six transducer.
3.5 – Testing
Tests in this chapter were conducted on the lawn of a residential garden. A drawing can be found in ANNEX D.1 of the area and surrounding elements. The loudspeaker was mounted on a tripod stand in the centre of the lawn at a height of 1.8m. The height was limited by the extension of the stand. It was determined that this height was sufficient to prevent any ground reflection that could cause destructive interference.
Two microphones were used to take separate measurement positions simultaneously and speed up the process. The measurement software was calibrated and set to capture sound pressure level and frequency response in 1/3rd octave bandwidths. Properties of the test equipment used are listed in ANNEX C. All factors concerning measurement uncertainties are covered in Chapter 3.5.5. Microphones and Pre-amplifiers were calibrated prior to and after the tests were conducted. The largest calibration drift recorded was 0.02dB.
3.5.1 – Frequency Response
To achieve an equal sound output level across the workable frequency range, a DSP (Digital Signal Processor) was used to apply audio signal filtering to the signal being fed from the signal generator to the audio amplifier.
Table 3 below shows the digital equalization filters applied and Graph 12 displays the frequency response prior the application of the filters, post filter application, and the processed signal path of the processor output. Twelve measurement positions, at random locations in a near-field radius (0.5 – 1.2m) were taken pre and post filtering using a transfer function measurement. These twelve measurements with averaged for both pre and post filter application. The noise source used for the testing was pseudo-random, synchronized pink noise.


3.5.2 – Directivity
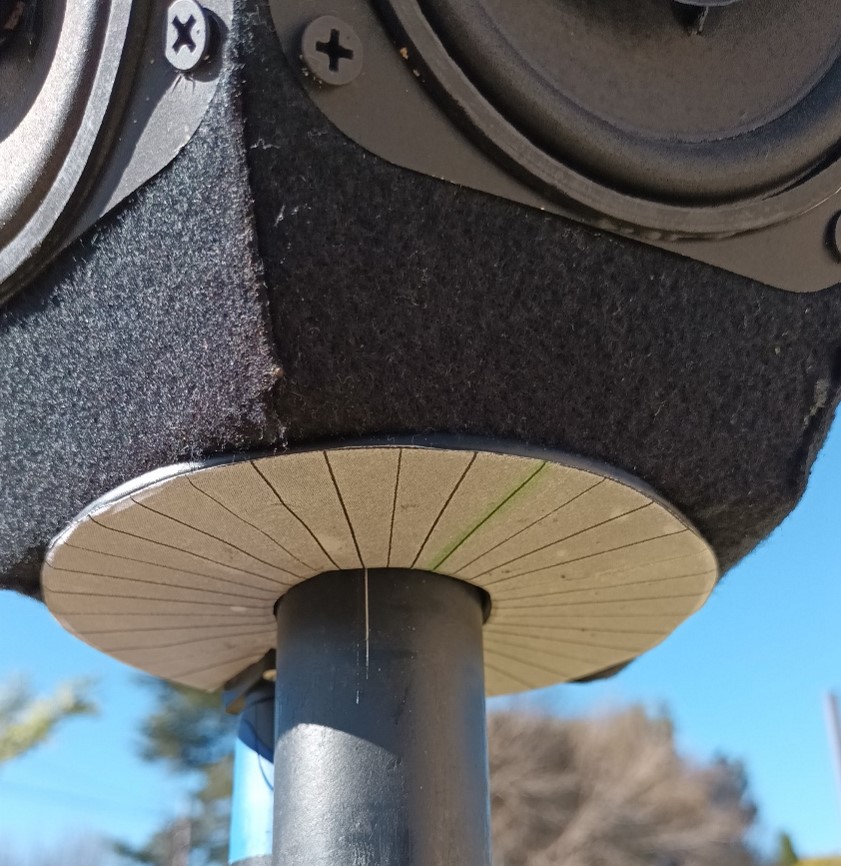
To meet the requirements set out by the standards mentioned in the introduction, 72 measurements need to be taken at 5˚ increments on a fixed axial plane. Due to the measurement environment not being truly free-field and limitations with the lack of accuracy of hand-adjusted microphone positions, measurements were taken at 10˚ increments. A circular template with 36 marked lines at 10˚ increments was printed out and fixed to the round top-hat where the loudspeaker rests on the tripod stand. A mark was made on the pole of the tripod. The loudspeaker was rotated to line up the mark on the pole with the lines on the marker template. Image 4 below shows the loudspeaker on the tripod with the marker template in place.
A total of 577 measurement positions were taken. One measurement right at the top of the loudspeaker, fixing the starting 0˚ vertical position. Microphone positions were 10˚ apart at 16 locations on the vertical plane. ANNEX D.2 provides images of the drawings made to calculate the depth and height of the positions. The loudspeaker was rotated 36 times at 10˚ increments, following template. This was repeated on each vertical position.
Un-weighted 1/3rd octave frequency band measurements from 63Hz to 16000Hz were captured. Initially a time average of 15 seconds was selected, but due to intermitted background noise and random gusts of wind, the time-average was reduced to 5 seconds and captured when surrounding elements were stable. A time average is continuously sampled sound pressure level data averaged to a single figure for a specified time period. For each vertical axis separately, the 36 captured results were split into 12 sections to provide an average level for each 30˚ segments. The levels from the 36 positions were averaged to provide an over-all level for that axis. Each of the 30˚ averaged results were subtracted (F6) from the overall averaged result for the axis to provide the level deviation. The same process was applied to the octave frequency bands from 63Hz to 8000Hz for compliance to ISO 3382-1.
Graph 13 and Graph 14 provide the deviation from the omnidirectional sound radiation of the loudspeaker for one of the horizontal and vertical planes, respectively. These results are then compared to the minimum requirements set out by the standards.

3.5.3 – Polar response
The 577 recorded measurements were separately plotted for each axis (16-Horizontal planes, 17-Vertical planes) on a circular graph using Microsoft Excel in 1/3rd octave frequency bands. To position the X and Y coordinates on the graph, mathematical function SIN (F7) and COS (F8) were applied to the levels recorded for each 1/3rd octave band at each 10˚ interval. This plotted the recorded level in a circular pattern to illustrate the output level response at each measurement.
For the horizontal plane, markings were made on the base of the loudspeaker and rotated in 10˚ steps on the mounted tripod stand. For the vertical plane, the loudspeaker was in a static position and the microphone position was adjusted in 10˚ increments around the radius, using distance from base of the tripod and height from that distance. As mentioned previously the 180˚ vertical position could not be captured due to the tripod presence. The result can be seen on the vertical polar plots by a gap in the data line. These were the same measurement positions used in 3.5.2 for the directivity testing.
For this procedure two measurement microphones were used at the same time to save on time. Frequency calibration from the manufacturers for each microphone were applied to the measurement software for accuracy. More information on test equipment can be found in ANNEX C.
Graph 15 below displays the unweighted linear sound pressure levels recorded at 10˚ increments on one horizontal and one vertical plane and plotted on a polar response. 1/3rd Octave frequency band polar response graphs can be found in ANNEX D for both the Horizontal and Vertical Plane.

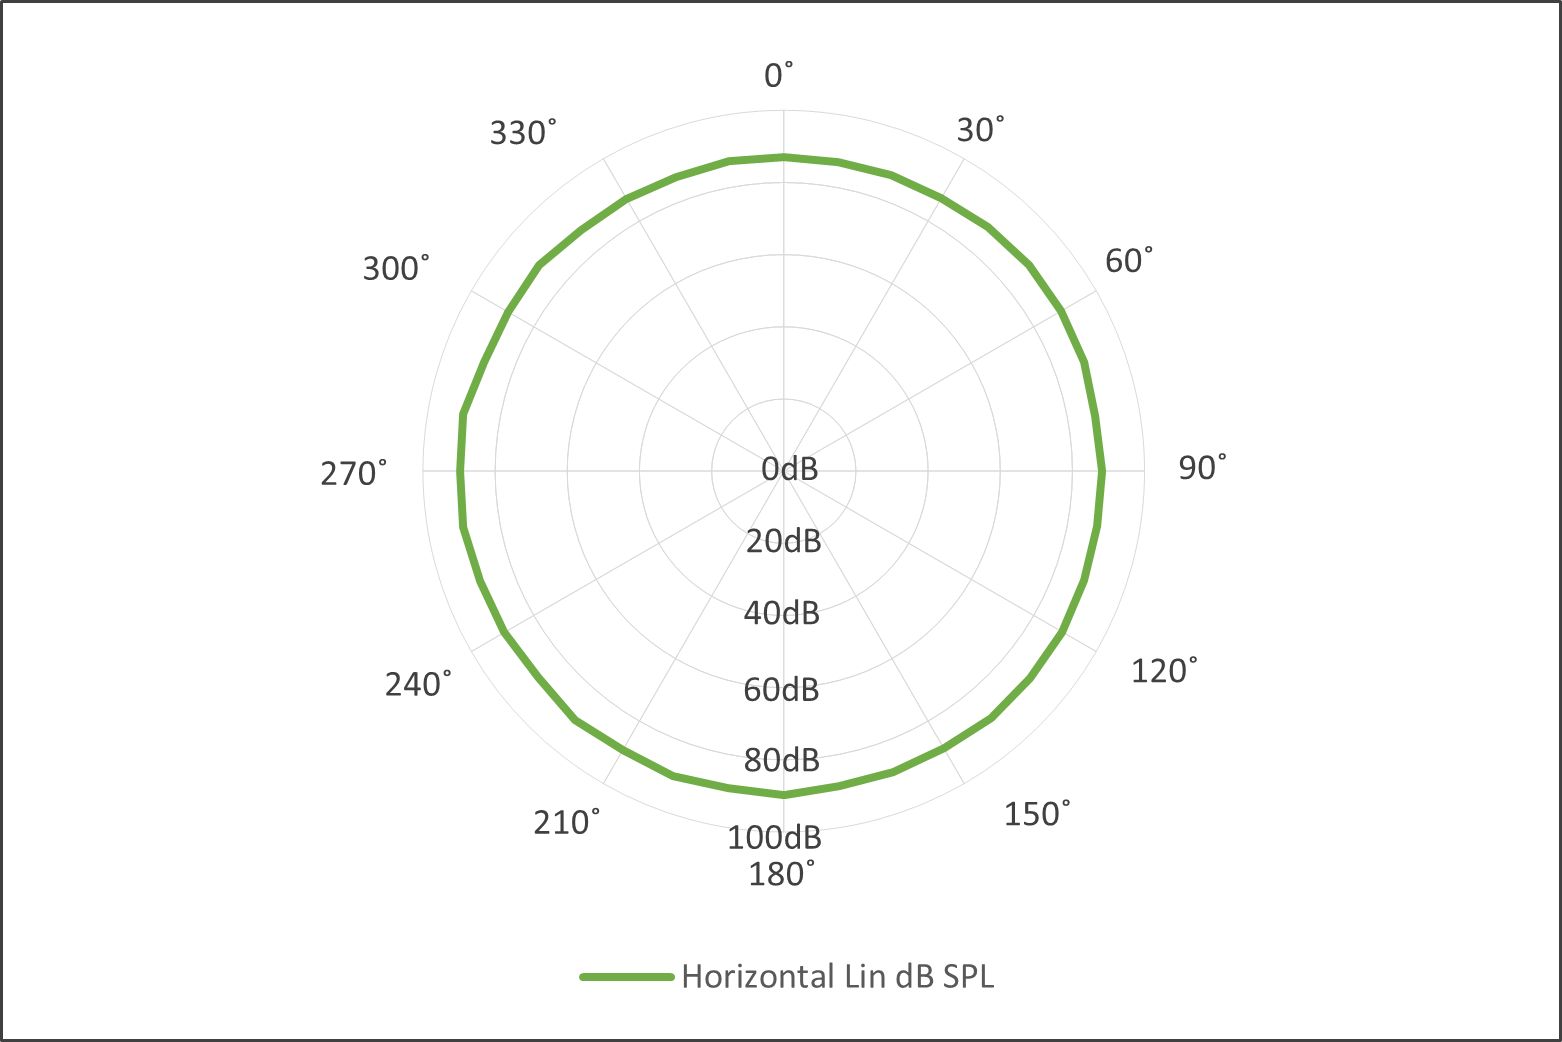
Graph 15 – Horizontal and Vertical 1/3rd octave frequency polar response of the unweighted linear sound pressure levels of the omnidirectional loudspeaker at 10˚ intervals.
3.5.4 – Sound Power Level
Sound Power Level (LW) provides a calculated single figure value from measured Sound Pressure Levels, that relates to the sound source’s acoustic power, independent from its environment. This is a valuable metric used in prediction models for room acoustics that pertain to direct and reverberant sound fields.
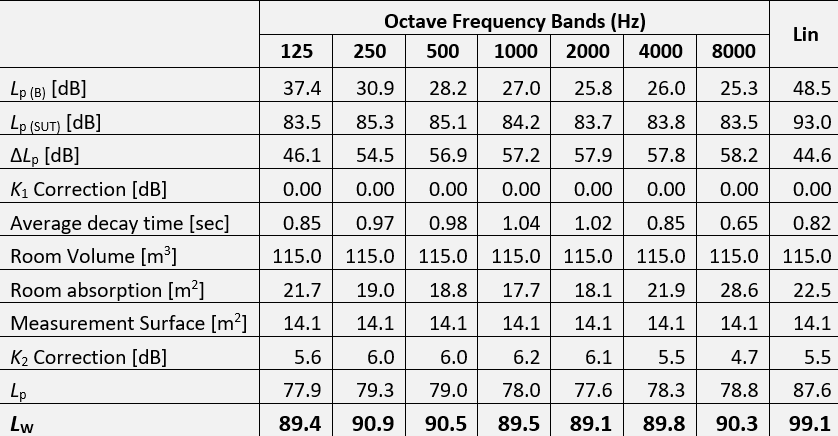
The Sound Power Level of the loudspeaker was measured and calculated using ISO 3744:2010 (18). The reference box shape chosen was hemispherical with a measurement surface at 1.5m from the centre. The measurement surface area (S) of the hemisphere is calculated at 14.1m2 (F9). The measurements were taken indoors in a diffuse field environment. With the loudspeaker producing broadband noise, Table B.2 from ANNEX B in the standard was used to determine the twenty microphone positions. Table 4 provide the calculated X, Y and Z coordinates for the microphone positions.

Two measurements were taken using a 1-minute, un-weighted equivalent continuous level (Leq,1min) at each position. The first was to measure the background noise level at the position. The second was the sound pressure level of the loudspeaker producing full-spectrum pink noise at maximum output volume. For each position individual octave frequency band between 125Hz and 8,000Hz was captured, as well as the full spectrum levels.
Correction for background noise in each octave band and full spectrum was calculated as per section 8.2.3 in the standard. The level difference (ΔLp) is determined by subtracting the averaged measured background noise levels (Lp(B)) from the averaged measured levels (L′p(ST)) of the loudspeaker in operation (F10). The correction factor (K1) is then calculated using Formula 11 with the calculated level difference between the sound source and the background noise levels.
Correction for environmental factors that concern the reverberation qualities of the room (K2) is calculated. A survey method is used to determine the average reverberation time of the room. Sabines’ equation is used to then calculate the absorption properties. Formula 12 is then used to determine the correction factor.
Both correction factors are subtracted from the averaged measured sound levels of the sound source (F13). Formula 14 is then applied to this level to determine the Sound Powel Level of the sound source under test.

3.5.5 – Measurement uncertainty
The following could have (and have) attributed to measurement uncertainties.
Measurement environment uncertainty:
- The loudspeaker was positioned 1.8m on a tripod to avoid any ground reflection. The tripod was positioned in the middle of the lawn with any reflecting boundary walls or building structures more than 5m away. Even though these precautions were taken with positioning, it is highly likely that reflections interfered with the measurements.
- The wind conditions were erratic during the test period. This limited the use of the 15 second time-average to a 5 second time-average. The stability of each measurement position was determined visually, and then captured manually by the operator.
- Environmental noise was minimal but there was the random presence of passing cars, barking dogs, gardening equipment, birdsong, and wind noise.
Equipment uncertainty:
- Two brands of Class 1 microphones were used. One brand uses a frequency calibration file that covers the whole spectrum. The other brand only applies frequency calibration from 750 Hz upward. Unmatched frequency responses between the two brands could have caused inaccuracy in the measurements.
- Physical positioning of the microphone positions with the tripod mic stands was not very precise. A laser-distance measurement tools was used, but human error in the inaccuracy of the positioning may play a role in uncertainty.
- On the dodecahedron loudspeaker the transducer placement and orientation per pentagon side were not fixed in a sequential pattern due to limited space. This could have affected the omnidirectionality of the sound radiation.
Calculation uncertainty:
- Calculations were made in Microsoft Excel. Care was taken with the large amount of data collected, errors could have been present.
- The formulas and procedures in the standards were thoroughly researched and investigated to ensure all steps were taken to accurately fulfil the calculations. Not properly following the steps or misunderstanding of the procedure could have led to inaccuracy.
3.6 – Conclusions
The use of the signal processor improved the tonal balance performance. The amount of filtering required was expected due to the nature of the enclosure and the mounting of the transducers. The filtering was executed successfully to tonally balance the frequency output in all directions.
The directivity test results show that the loudspeaker passes both octave and 1/3rd octave requirements. The 4” transducers have their limitations in the lower frequency bands below 125Hz and also in the higher frequencies above 4000Hz. This can be seen by the larger deviations in directivity in these bands. Favorable results in the mid frequency bands between 250Hz and 2500Hz.
The polar plots provide insightful visual representations of the omnidirectionality that aligns with the deviation results. Creating the polar plots in Microsoft Excel was reasonably easy but required careful consideration of large amounts of data and correct application of formulas.
The sound power level procedure was not done at maximum output level, to prevent damage to the loudspeaker or causing distortion. The output level is sufficient but might prove to be a bit low when taking measurements in noisy environments.
The finished product yields favorable test results that meet the requirements of the standards.
4 – Acknowledgements
Special thanks are given to the following individuals in their contributions to this project.
- Coralie Van Reenen for her valuable insight into the subject of room acoustics in classrooms. She has pioneered research into this study and her willingness to share insights gained during her research is much appreciated.
- Ivan Lin, from Linspace Acoustics, for sharing perspective gained in his years of experience in the building acoustics.
- Bennet Prescott for his professional input regarding the build of the dodecahedron loudspeaker. His technical knowledge and professional experience had an impact on Part 3 of this report.
- Reg Joubert for his editorial role and extensive experience in reading and writing documentation as an attorney.
5 – References:
- (1) Notice No of 2009 – South African Schools Act 84 of 1996 – Department of Education. (https://www.gov.za/documents/south-african-schools-act)
- (2) School Realities December 2022 (https://www.education.gov.za/Portals/0/EMIS/School%20Realities%20December%202022.pdf?ver=2022-12-12-112304-000)
- (3) World Health Organization – Guidelines for community noise (https://apps.who.int/iris/handle/10665/66217)
- (4) SANS 10103:2008 (Edition 6) The measurement and rating of environmental noise with respect to annoyance and to speech communication. (https://store.sabs.co.za/catalog/product/view/id/217983/s/sans-10103-2008-ed-6-00/)
- (5) Public and Education Building v1 – Technical Manual Green Star SA – Green Building Council of South Africa 2013 (https://api.gbcsa.org.za/resources/download/243)
- (6) ISO 140-4:1998 Acoustics — Measurement of sound insulation in buildings and of building elements (Field measurements of airborne sound insulation between rooms) (https://www.iso.org/standard/2210.html)
- (7) ISO 16283-1:2014 Acoustics — Field measurement of sound insulation in buildings and of building elements (Airborne sound insulation) (https://www.iso.org/standard/55997.html)
- (8) Acoustics in South African classrooms: Regulations versus reality, 2021 (https://researchspace.csir.co.za/dspace/handle/10204/12106)
- (9) Statista Research Department – Number of schools in South Africa in 2022, by sector, 2021 (https://www.statista.com/statistics/1262871/number-of-schools-in-south-africa-by-sector/)
- (10) BS 8233-2014 – Guidance on sound insulation and noise reduction for buildings (https://knowledge.bsigroup.com/products/guidance-on-sound-insulation-and-noise-reduction-for-buildings/standard)
- (11) BS EN 60268-16 2011 – Sound System Equipment – Objectively rating of speech intelligibility by speech transmission index (https://knowledge.bsigroup.com/products/sound-system-equipment-objective-rating-of-speech-intelligibility-by-speech-transmission-index-2/standard)
- (12) BS EN ISO 3382-2-2008 Acoustics – Measurements of room acoustic parameters (Ordinary Rooms) (https://www.iso.org/standard/36201.html#:~:text=Abstract&text=ISO%203382%2D2%3A2008%20specifies,and%20presenting%20the%20test%20report.)
- (13) Stephens RW, Bate AE (1966). Acoustics and Vibrational Physics (2nd ed.) (https://www.amazon.com/Acoustics-Vibrational-Physics-Bate-Stephens/dp/B001399Z8A)
- (14) BS EN ISO 3382-1-2009 Acoustics – Measurements of room acoustic parameters (Performance spaces) (https://www.iso.org/standard/40979.html#:~:text=ISO%203382%2D1%3A2009%20specifies,and%20presenting%20the%20test%20report.)
- (15) BS EN ISO 10140-5-2010 Acoustics – Laboratory measurement of sound insulation of building elements (Requirements for testing facilities and equipment) (https://www.iso.org/standard/42087.html)
- (16) BS EN ISO 16283-1-2014 Acoustics – Field measurement of sound insulation in buildings and of building elements (Airborne sound insulation) (https://www.iso.org/standard/55997.html)
- (17) Sound Certified – Speaker Ohms Calculator. (https://soundcertified.com/speaker-ohms-calculator/)
- (18) ISO 3744 2010 Acoustics – Determination of power levels and sound energy levels of noise sources using sound pressure (Engineering method, free field over reflecting plane) (https://www.iso.org/standard/52055.html#:~:text=ISO%203744%3A2010%20specifies%20methods,one%20or%20more%20reflecting%20planes.)

6. Relevant Formula
Formula 1 – Calculation of Absorption Area.
A = 0.161 * (V/T ) [m2]
Where:
T is the measured reverberation time in seconds,
V is the room volume in m3.
Formula 2 – Sabine calculation of Absorption Coefficient.
α = A/S
Where:
A is the calculated Absorption Area in m2 calculated in formula 1,
S is the total Surface Area of the room in m2.
Formula 3 – Stevens and Bate calculation of optimal reverberation time.
RT = 4(0.0118V1/3+0.107) [sec]
Where:
4 is the constant for human speech,
V is the room volume in m3.
Formula 4 – Calculation of Room Constant.
RC = S * αAVGE/(1 – αAVGE) [m2]
Where:
S is the total Surface Area of the room in m2,
αAVGE is the averaged absorption coefficient based on the measured decay time of the room.
Formula 5 – Calculation of Room Radius.
R = √[Q * RC/16π] [m]
Where:
Q is the Directivity factor of the sound source,
RC is the room constant calculated in Formula 4.
Formula 6 – Calculation of directivity indices.
DIi=Li 360° – Li30° [dB]
Where:
L i 360° is the averaged level across the axis,
L i 30° is the averaged level for each 30 degree segment of the axis.
Formula 7 – Polar Plot X-axis position
Plot X-Axis =Lp*SIN(θ/180*π)
Where:
Lp is the measured sound pressured level at the set angle on the axis,
θ is the angle on the axis where the measurement is being taken.
Formula 8 – Polar Plot Y-axis position
Plot Y-Axis =Lp*COS(θ/180*π)
Where:
Lp is the measured sound pressured level at the set angle on the axis,
θ is the angle on the axis where the measurement is being taken.
Formula 9 – Surface area of a hemispherical measurement shape
S = 2πr2 [m2]
Where:
r is the radius distance away from the centre of the hemispherical shape around the sound source.
Formula 10 – Calculation of level difference between sound source under test and background noise levels.
ΔLp = Lp(SUT) – Lp(B) [dB]
Where:
Lp(SUT) is the average measured sound pressure level of the sound source under test,
Lp(B) is the averaged background noise level.
Formula 11 – Background noise correction factor calculation.
K1 = – 10*log(10)(1-10-0.1* ΔLp) [dB]
Where:
ΔLp id the level difference between the sound source and the background noise level calculated in formula 10.
Formula 12 – Correction calculation for environmental influence of the testing room.
K2 = 10*log(10)[1+4*(S/A) [dB]
Where:
S is the surface area calculated in formula 9 for the measurement surface,
A is the calculated Absorption area of the testing room.
Formula 13 – Correction factors applied to measured sound source.
Lp = Lp (SUT) – K1 – K2 [dB]
Formula 14 – calculation to determine Sound Power Level.
LW = Lp + 10log(10)(S/S0) [dB]
Where:
S is the surface area calculated in formula 9 for the measurement surface,
S0 = 1 m2
ANNEX A
A.1 – Notice No of 2009 – South African Schools Act 84 of 1996 – Department of Education.
ANNEX B.1 – SCHOOL A
B.1.1 – Geographical Information


B.1.2 – Classroom Information
School A Classroom 1

School A Classroom 2

School A Classroom 3

ANNEX B.2 – SCHOOL B
B.2.1 – Geographical Information

B.2.2 – Classroom Information
ANNEX B.3 – SCHOOL C
B.3.1 – Geographical Information
School C Classroom 1

School C Classroom 2
ANNEX C – Test Equipment
Measurement Microphones
iSEMcon EMX-7150

- Frequency range: 10Hz-20kHz
- Sensitivity: 6mV/Pa typ.
- Power required: 12-48V DC
- Dynamic range: ~30 >140dBspl
- 3% distortion limits: 145dBspl typ.
- Calibration chart and calibration data files from my.isemcon.com
- IEC 61672 class 1 frequency response
- Dimensions: acoustic port dia. 1/4″ (7mm); Microphone body 0.75″ (19mm); Overall length 6″ (152mm)
Earthworks M30
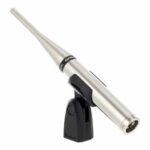
- Frequency response: 3Hz to 30kHz
- Polar pattern: Omnidirectional
- Sensitivity: 34mV/Pa (-29dBV/Pa)
- Power requirements: 24-48V Phantom, 10mA
- Maximum acoustic input: 140dB SPL
- Dimensions (L x D): 229mm x 22mm (9.0 x .860 inches)• Weight: 0.5 lb. (225g)
Amplitude Calibrator
iSEMcon SC-1
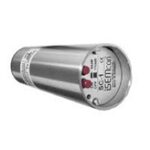
- Frequency: 1kHz +- 0.2%
- SPL: 110dB – 94dB switchable
- Accuracy: +- 0.5dB at 20 Grad Celsius and 1013 mbar
- Ambient temperature range: 0 – 45 Grad Celsius
- Temperature drift: < 0.02dB per Grad Celsius
- Temperature drift frequency: < 0.05Hz per Grad Celsius
- Storage temperature range: -25-55 Grad Celsius (without battery)
- Humidity: 5 bis 95% relative
- Power supply: 9V battery or accumulator
- Housing: Aluminium, PVC
- Dimensions: Dia. 40mm, Length 132mm
- Weight (without battery): 164g
Pre-Amplifier/Capture Card
Presonus Audiobox 96
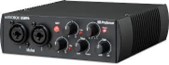
- 2in/2out USB Bus Powered
- Frequency Response (±3.0 dB): 20 Hz to 20 kHz
- Input Impedance (Balanced): 1200Ω
- THD+N (unwtd, 1 kHz @ +4 dBu Output, Unity Gain): < 0.008%
- S/N Ratio (Unity Gain, Ref. = +4 dBu, 20 Hz to 22 kHz): > 95 dB
- Common Mode Rejection Ratio (1 kHz, 55 dB Gain): > 45 dB
- Gain Control Range (± 2 dB): +6 dB to +52 dB
- Max Input Level (Unity Gain, 1 kHz @ 0.5% THD+N): -3 dBu
- Phantom Power (±2 VDC): +48 VDC
- ADC Dynamic Range (A-wtd, 48 kHz Sample Rate): 105 dB
- DAC Dynamic Range (A-wtd, 48 kHz Sample Rate): 105 dB
- Bit Depth: 24
- Reference Level for 0 dBFS: +4 dBu
- Supported Sample Rates (kHz): 44.1, 48, 88.2, 96
- Power: USB 2.0 bus-powered
Software
Smaart v9 Suite – Impulse Response Mode (IR Mode)
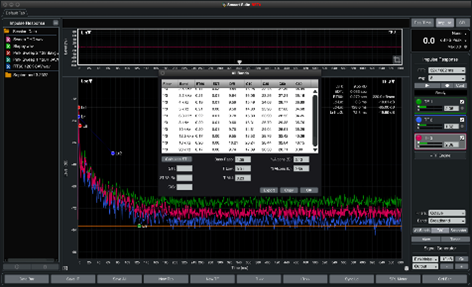
- Linear, Logarithmic, Energy Time Curve, Spectrogram, Frequency, and Histogram graphs.
- Unlimited simultaneous IR measurement.
- Single and Dual channel IR measurement capability.
- Single time window FFT selections from 128-512k.
- Schroeder Reverse Integration curve for RT60 and EDT calculation.
- Speech intelligibility criterion including CIS, STI, and STIPA.
- Supports Noiseless and Noise Present STI calculation.
- Automatic calculation of octave and 1/3 octave filter band passes.
- User-definable frequency bandpass.
- All-Bands table view for all acoustical values.
SPL (Sound Pressure Level) Mode
- Monitoring and Logging of an unlimited number of calibrated inputs.
- SPL A, C, & Unweighted Fast and Slow.
- Peak C, Peak Z (unweighted), Peak A, and Peak Octave banded frequency.
- Leq A, C, unweighted, and Octave band with user definable time-period from 1sec-24 hours.
- L10, L50, L90 calculation
ANNEX D.1 – Measurement Environment

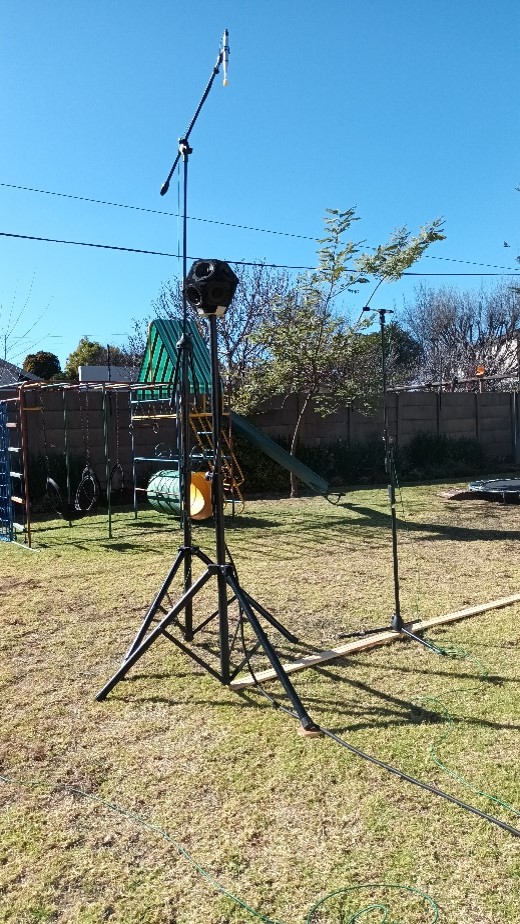

Images D.1 – images of outdoor measurement environment for tests conducted on the omnidirectional loudspeaker.
ANNEX D.2 – Microphone Positions